ETFOptimize | High-performance ETF-based Investment Strategies

Quantitative strategies, Wall Street-caliber research, and insightful market analysis since 1998.


ETFOptimize | HOME
Close Window

What Are Wall Street Analysts' Target Price for Clorox Stock?

Oakland, California-based The Clorox Company (CLX) produces and sells consumer and professional products. Valued at $12.8 billion by market cap, the company offers cleaning and disinfecting products, cat litter, bags and wraps, grilling supplies, dressings and sauces, water filtration systems, personal care items, and vitamins under brands like Clorox, Brita, Burt’s Bees, Glad, Kingsford, and Hidden Valley.

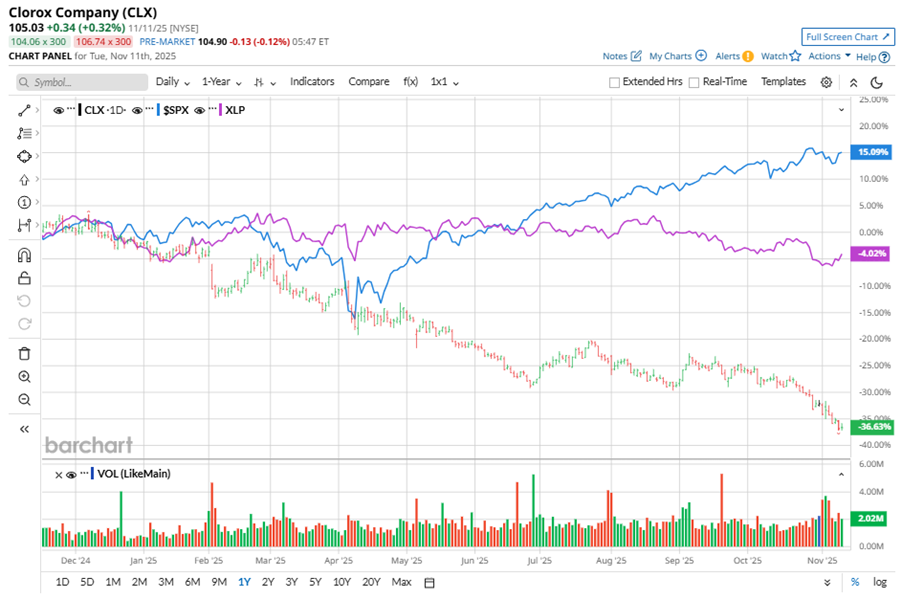
Shares of this consumer products giant have significantly underperformed the broader market over the past year. CLX has declined 36.4% over this time frame, while the broader S&P 500 Index ($SPX) has rallied nearly 14.1%. In 2025, CLX stock is down 35.3%, compared to SPX’s 16.4% rise on a YTD basis. 


Narrowing the focus, CLX’s underperformance is also apparent compared to the Consumer Staples Select Sector SPDR Fund (XLP). The exchange-traded fund has declined about 3.9% over the past year. Moreover, the ETF’s 1.5% dip on a YTD basis outshines the stock’s double-digit losses over the same time frame.

www.barchart.com

CLX faced challenges from ERP rollout disruptions, value-seeking consumers, and increased promotions. 

On Nov. 3, CLX shares closed down by 3% after reporting its Q1 results. Its adjusted EPS of $0.85 surpassed Wall Street expectations of $0.78. The company’s revenue was $1.43 billion, beating Wall Street forecasts of $1.38 billion. CLX expects full-year adjusted EPS in the range of $5.95 to $6.30.

For the current fiscal year, ending in June 2026, analysts expect CLX’s EPS to decline 23.5% to $5.91 on a diluted basis. The company’s earnings surprise history is mixed. It beat the consensus estimate in three of the last four quarters while missing the forecast on another occasion.

Among the 19 analysts covering CLX stock, the consensus is a “Hold.” That’s based on one “Strong Buy” rating, 13 “Holds,” and five “Strong Sells.”

www.barchart.com

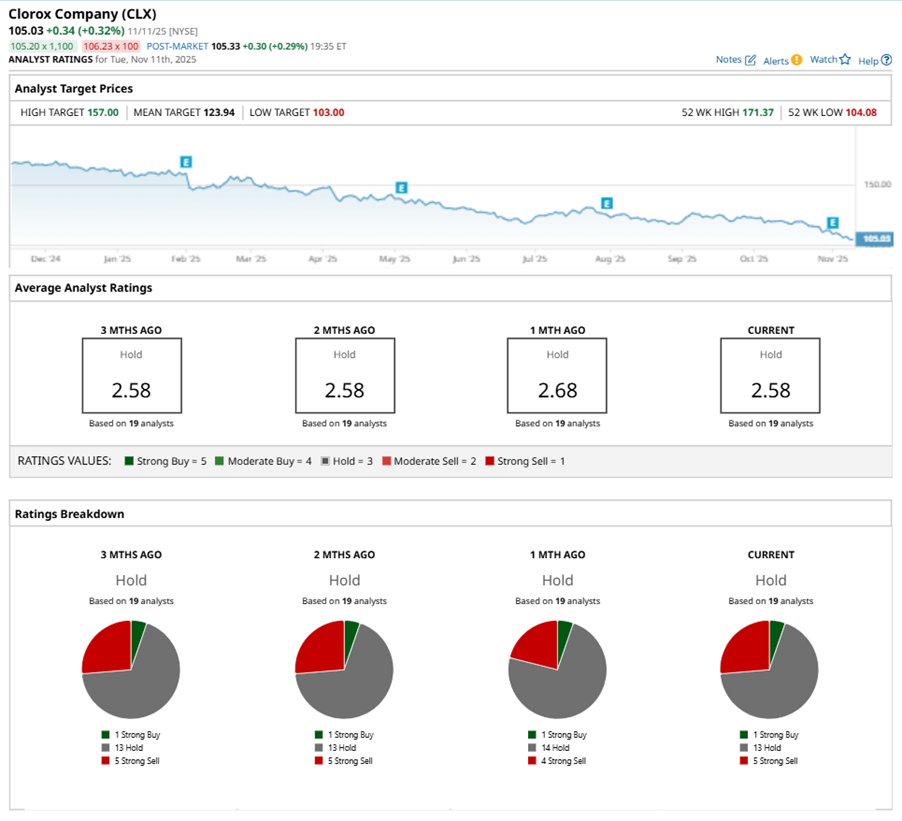
This configuration is more bearish than a month ago, with four analysts suggesting a “Strong Sell.”

On Nov. 4, Nik Modi from RBC Capital maintained a “Hold” rating on CLX with a price target of $142, implying a potential upside of 35.2% from current levels.

The mean price target of $123.94 represents an 18% premium to CLX’s current price levels. The Street-high price target of $157 suggests an ambitious upside potential of 49.5%.


On the date of publication, Neha Panjwani did not have (either directly or indirectly) positions in any of the securities mentioned in this article. All information and data in this article is solely for informational purposes. For more information please view the Barchart Disclosure Policy here.

Recent Quotes

View More
Symbol Price Change (%)
AMZN  244.88
-4.22 (-1.69%)
AAPL  273.60
-1.65 (-0.60%)
AMD  256.39
+18.87 (7.94%)
BAC  54.09
+0.45 (0.85%)
GOOG  286.79
-4.95 (-1.70%)
META  610.61
-16.48 (-2.63%)
MSFT  510.05
+1.37 (0.27%)
NVDA  191.57
-1.59 (-0.82%)
ORCL  227.80
-8.35 (-3.54%)
TSLA  429.54
-10.08 (-2.29%)
Stock Quote API & Stock News API supplied by www.cloudquote.io
Quotes delayed at least 20 minutes.
By accessing this page, you agree to the Privacy Policy and Terms Of Service.


IntelligentValue Home
Close Window

DISCLAIMER

All content herein is issued solely for informational purposes and is not to be construed as an offer to sell or the solicitation of an offer to buy, nor should it be interpreted as a recommendation to buy, hold or sell (short or otherwise) any security.  All opinions, analyses, and information included herein are based on sources believed to be reliable, but no representation or warranty of any kind, expressed or implied, is made including but not limited to any representation or warranty concerning accuracy, completeness, correctness, timeliness or appropriateness. We undertake no obligation to update such opinions, analysis or information. You should independently verify all information contained on this website. Some information is based on analysis of past performance or hypothetical performance results, which have inherent limitations. We make no representation that any particular equity or strategy will or is likely to achieve profits or losses similar to those shown. Shareholders, employees, writers, contractors, and affiliates associated with ETFOptimize.com may have ownership positions in the securities that are mentioned. If you are not sure if ETFs, algorithmic investing, or a particular investment is right for you, you are urged to consult with a Registered Investment Advisor (RIA). Neither this website nor anyone associated with producing its content are Registered Investment Advisors, and no attempt is made herein to substitute for personalized, professional investment advice. Neither ETFOptimize.com, Global Alpha Investments, Inc., nor its employees, service providers, associates, or affiliates are responsible for any investment losses you may incur as a result of using the information provided herein. Remember that past investment returns may not be indicative of future returns.

Copyright © 1998-2017 ETFOptimize.com, a publication of Optimized Investments, Inc. All rights reserved.