Intercontinental Exchange, Inc. (ICE) is a leading global operator of financial markets that manages exchanges and clearinghouses worldwide. The company provides platforms for trading futures, options, equities, and commodities, as well as data, analytics, and mortgage technology solutions.
ICE enhances market transparency, facilitates risk management, and supports capital raising across various asset classes. Its headquarters is in Atlanta, Georgia, USA, where it drives efficient market connectivity and trade execution through advanced electronic systems. The company has a market capitalization of $88.05 billion, indicating it is a “large-cap” stock.
The company’s stock reached a 52-week high of $189.35 on Aug. 8, but is down 19.3% from that level. Reflecting concerns about slowing trading volumes, ICE’s stock declined 15.4% over the past three months. Contrarily, the iShares U.S. Broker-Dealers & Securities Exchanges ETF (IAI) declined 3.2% over the same period, indicating that the stock has underperformed its investment services peers.
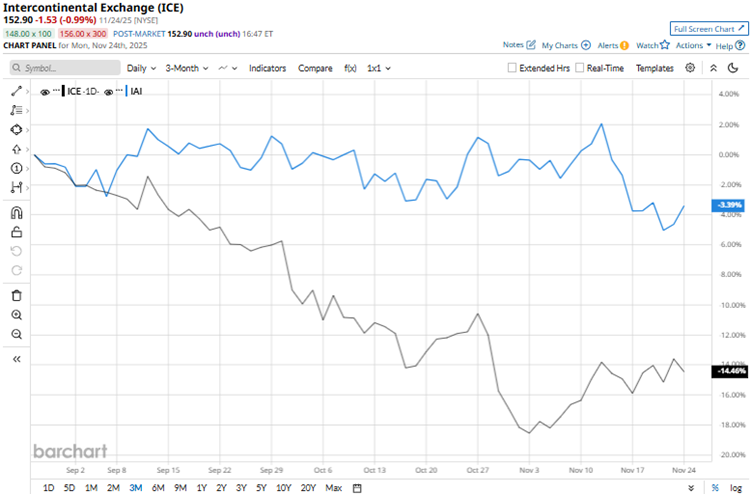
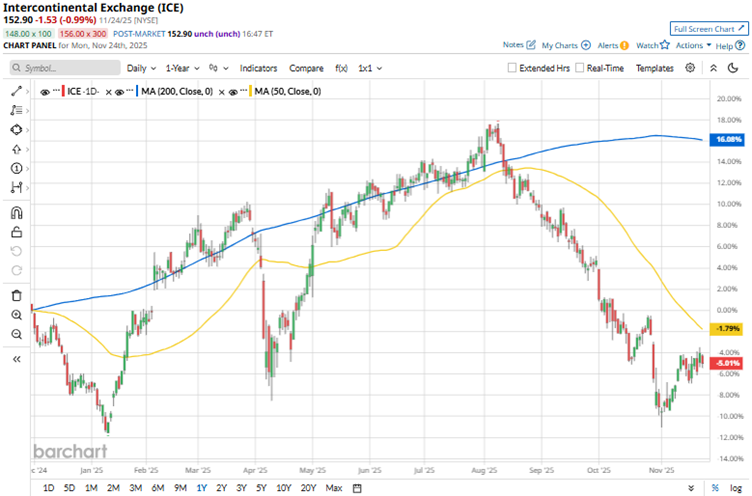
Over the longer term, this underperformance persists. Over the past 52 weeks, ICE’s stock has been down 4%, and over the past six months, it has been down 13.2%. On the other hand, the ETF gained 11.6% and 10.8% over the same periods, respectively. The stock has been trading below its 50-day and 200-day moving averages since early August.
On Oct. 30, ICE reported a modest 2.6% year-over-year (YOY) growth in net revenues to $2.41 billion for the third quarter of fiscal 2025. Its exchanges segment revenue increased marginally over the prior year’s period to $1.27 billion. Its adjusted earnings climbed 10.3% YOY to $1.71 per share, higher than the $1.62 per share that Wall Street analysts had expected. Despite these results, the stock dropped 1.4% intraday on Oct. 30 and 1.5% on Oct. 31.
ICE also highlighted its strategic investment of up to $2 billion in Polymarket, a prediction market platform. The company is looking to expand its footprint into the decentralized prediction markets through this investment.
We compare ICE’s performance with that of financial derivatives exchanges operator CME Group Inc. (CME), which has climbed 20.4% over the past 52 weeks but declined 3% over the past six months. Therefore, ICE has underperformed CME over these periods.
Wall Street analysts are strongly bullish on ICE’s stock. The stock has a consensus rating of “Strong Buy” from the 18 analysts covering it. The mean price target of $193.59 indicates a 26.6% upside compared to current levels. Moreover, the Street-high price target of $218 indicates a 42.6% upside.
On the date of publication, Anushka Mukherjee did not have (either directly or indirectly) positions in any of the securities mentioned in this article. All information and data in this article is solely for informational purposes. For more information please view the Barchart Disclosure Policy here.
More news from Barchart