Valued at a market cap of $811.3 billion, New York-based JPMorgan Chase & Co. (JPM) is the largest and most diversified bank in the United States, operating across consumer banking, commercial and investment banking, and asset and wealth management. Formed through the 2000 merger of J.P. Morgan & Co. and Chase Manhattan, the firm serves millions of consumers and global institutions through its massive branch network, leading credit card business, top-tier investment bank, and multitrillion-dollar asset management arm.
Companies worth more than $200 billion are generally labeled as “mega-cap” stocks and JPMorgan Chase fits this criterion perfectly. Known for its “fortress balance sheet,” strong capital position, and broad revenue streams, JPM consistently delivers industry-leading profitability while navigating credit, regulatory, and market risks. Its scale, global reach, and technological investments make it a bellwether for the financial sector and one of the most influential banks in the world.
JPM stock has decreased 7.5% from its 52-week high of $322.25 touched recently on Nov. 12. Shares of the company have increased marginally over the past three months, trailing the broader Nasdaq Composite’s ($NASX) 5.9% rise over the same time frame.
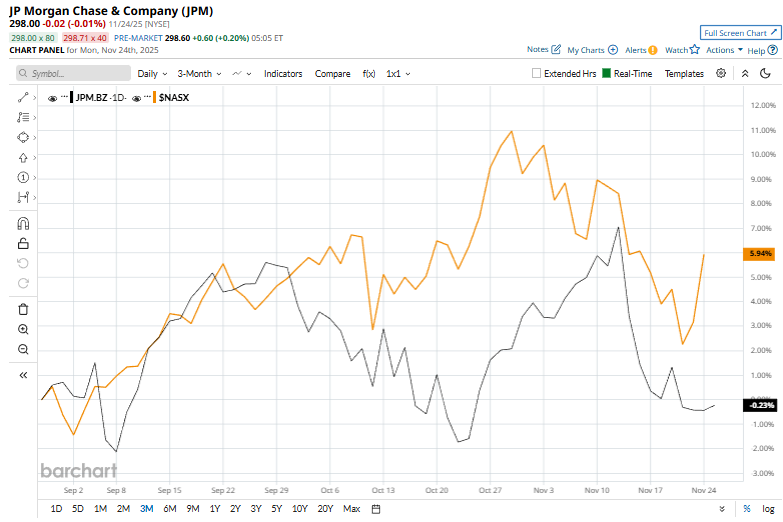
JPMorgan has posted a strong run this year, jumping 24.3% year-to-date and easily outperforming the NASDAQ’s 15.3% rise. However, over the past 52 weeks, JPM’s 19.9% gain trails the NASX’s stronger 20% advance.
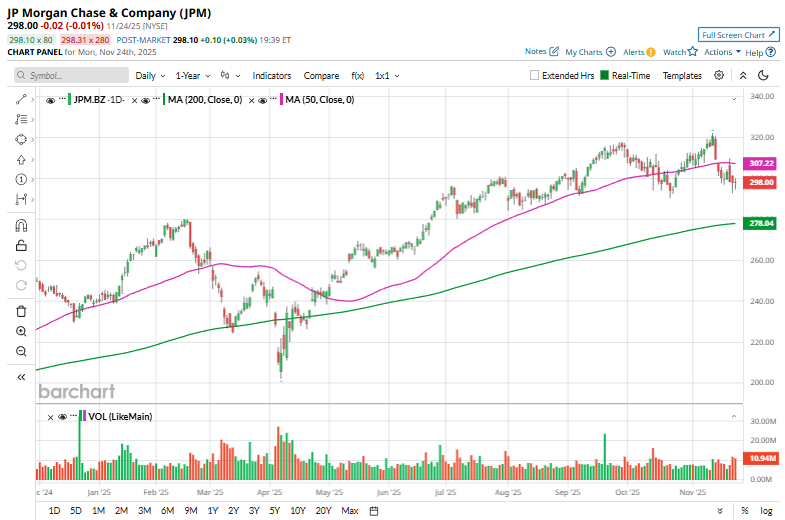
The stock has spent most of the past year comfortably above its 200-day moving average, signaling steady strength. But a recent slip below the 50-day moving average hints at a short-term cooling in momentum.
On Oct. 14, JPMorgan Chase shares slipped 1.9% despite the bank posting solid Q3 results. The company delivered net revenue of $46.4 billion, marking an 8.8% year-over-year increase, driven by broad strength across consumer banking, markets, and investment banking activity. Earnings also impressed, with EPS rising 16% from the prior-year quarter to $5.07, supported by strong trading revenue, resilient consumer spending, and healthy fee generation.
Nevertheless, JPM stock has surpassed its rival, Bank of America Corporation (BAC). BAC stock saw an 18.2% rise on a YTD basis and a 10.5% gain over the past 52 weeks.
Analysts remain cautiously optimistic about its prospects. The stock has a consensus rating of “Moderate Buy” from 27 analysts, and the mean price target of $327.48 represents a 9.9% premium to current levels.
On the date of publication, Kritika Sarmah did not have (either directly or indirectly) positions in any of the securities mentioned in this article. All information and data in this article is solely for informational purposes. For more information please view the Barchart Disclosure Policy here.
More news from Barchart