ETFOptimize | High-performance ETF-based Investment Strategies

Quantitative strategies, Wall Street-caliber research, and insightful market analysis since 1998.


ETFOptimize | HOME
Close Window

How Is Medtronic's Stock Performance Compared to Other Medical Devices Stocks?

Galway, Ireland-based Medtronic plc (MDT) develops, manufactures, and sells device-based medical therapies to healthcare systems, physicians, clinicians, and patients. Valued at $134.7 billion by market cap, the company's principal products include those for bradycardia pacing, tachyarrhythmia management, atrial fibrillation management, heart failure management, heart valve replacement, malignant and non-malignant pain, and movement disorders.

Companies worth $10 billion or more are generally described as “large-cap stocks,” and MDT perfectly fits that description, with its market cap exceeding this mark, underscoring its size, influence, and dominance within the medical devices industry. MDT's global presence and wide product range, covering chronic diseases like diabetes, cardiovascular conditions, and neurological disorders, are its key strengths. With around half of sales coming from international markets, the company has a diverse geographic reach that helps mitigate economic risks, reducing its dependence on any one product or market.


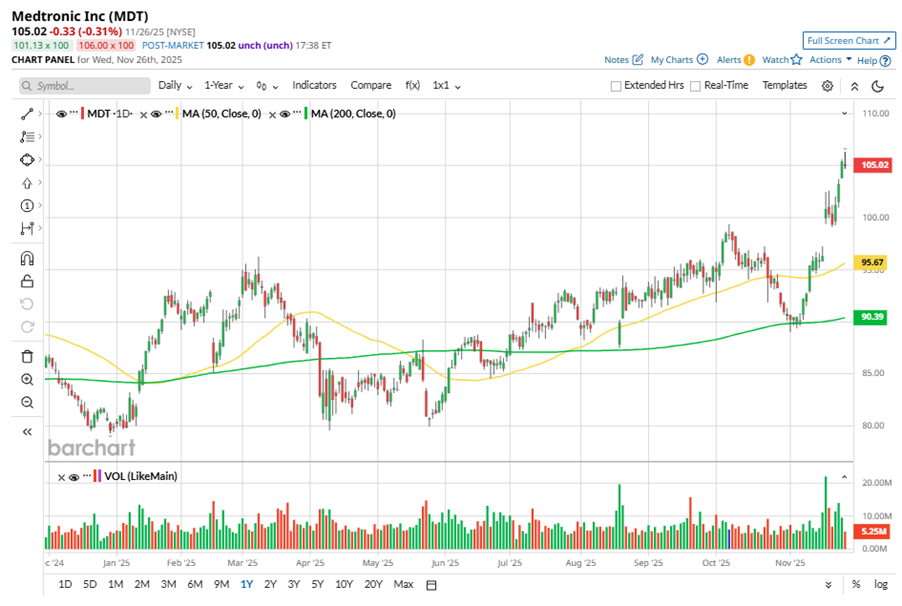
Despite its notable strength, MDT shares touched their 52-week high of $106.33 in the last trading session. Over the past three months, MDT stock gained 13.9%, outperforming the iShares U.S. Medical Devices ETF’s (IHI3.4% gains during the same time frame.

www.barchart.com

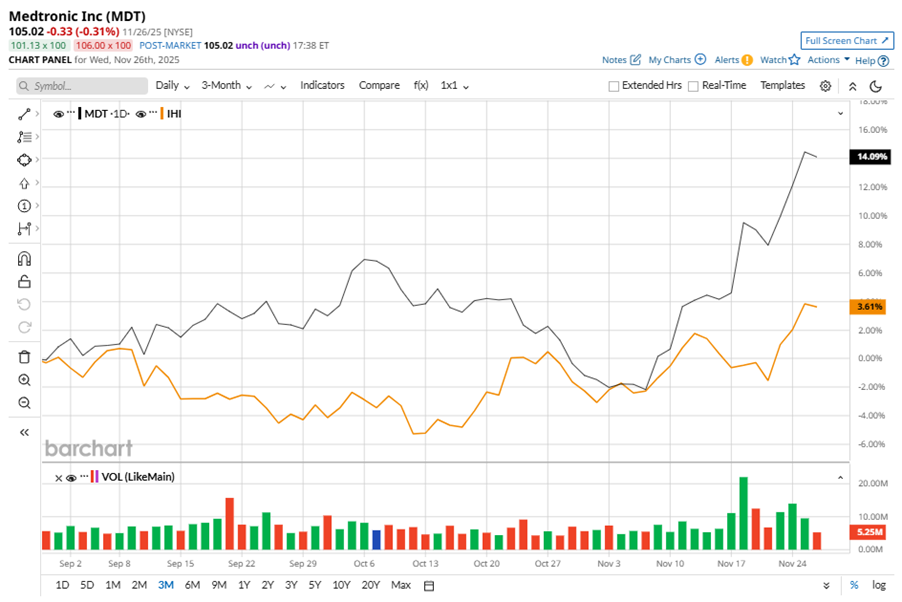
In the longer term, shares of MDT rose 31.5% on a YTD basis and climbed 22.6% over the past 52 weeks, outperforming IHI’s YTD gains of 10.3% and 6% returns over the last year.

To confirm the bullish trend, MDT has been trading above its 50-day moving average since early June, with some fluctuations. The stock has been trading above its 200-day moving average since late June, with slight fluctuations.

www.barchart.com

On Nov. 18, MDT shares closed up more than 4% after reporting its Q2 results. Its adjusted EPS of $1.36 exceeded Wall Street expectations of $1.31. The company’s revenue was $9 billion, surpassing Wall Street's $8.9 billion forecast. MDT expects full-year adjusted EPS in the range of $5.62 to $5.66.

In the competitive arena of medical devices, Abbott Laboratories (ABT) has lagged behind the stock, with a 13.6% gain on a YTD basis and 9% uptick over the past 52 weeks.

Wall Street analysts are reasonably bullish on MDT’s prospects. The stock has a consensus “Moderate Buy” rating from the 30 analysts covering it, and the mean price target of $111.42 suggests a potential upside of 6.1% from current price levels.


On the date of publication, Neha Panjwani did not have (either directly or indirectly) positions in any of the securities mentioned in this article. All information and data in this article is solely for informational purposes. For more information please view the Barchart Disclosure Policy here.


More news from Barchart

Recent Quotes

View More
Symbol Price Change (%)
AMZN  232.38
+0.00 (0.00%)
AAPL  284.15
+0.00 (0.00%)
AMD  217.60
+0.00 (0.00%)
BAC  54.09
+0.00 (0.00%)
GOOG  320.62
+0.00 (0.00%)
META  639.60
+0.00 (0.00%)
MSFT  477.36
-0.37 (-0.08%)
NVDA  179.59
+0.00 (0.00%)
ORCL  207.73
+0.00 (0.00%)
TSLA  446.74
+0.00 (0.00%)
Stock Quote API & Stock News API supplied by www.cloudquote.io
Quotes delayed at least 20 minutes.
By accessing this page, you agree to the Privacy Policy and Terms Of Service.


IntelligentValue Home
Close Window

DISCLAIMER

All content herein is issued solely for informational purposes and is not to be construed as an offer to sell or the solicitation of an offer to buy, nor should it be interpreted as a recommendation to buy, hold or sell (short or otherwise) any security.  All opinions, analyses, and information included herein are based on sources believed to be reliable, but no representation or warranty of any kind, expressed or implied, is made including but not limited to any representation or warranty concerning accuracy, completeness, correctness, timeliness or appropriateness. We undertake no obligation to update such opinions, analysis or information. You should independently verify all information contained on this website. Some information is based on analysis of past performance or hypothetical performance results, which have inherent limitations. We make no representation that any particular equity or strategy will or is likely to achieve profits or losses similar to those shown. Shareholders, employees, writers, contractors, and affiliates associated with ETFOptimize.com may have ownership positions in the securities that are mentioned. If you are not sure if ETFs, algorithmic investing, or a particular investment is right for you, you are urged to consult with a Registered Investment Advisor (RIA). Neither this website nor anyone associated with producing its content are Registered Investment Advisors, and no attempt is made herein to substitute for personalized, professional investment advice. Neither ETFOptimize.com, Global Alpha Investments, Inc., nor its employees, service providers, associates, or affiliates are responsible for any investment losses you may incur as a result of using the information provided herein. Remember that past investment returns may not be indicative of future returns.

Copyright © 1998-2017 ETFOptimize.com, a publication of Optimized Investments, Inc. All rights reserved.