ETFOptimize | High-performance ETF-based Investment Strategies

Quantitative strategies, Wall Street-caliber research, and insightful market analysis since 1998.


ETFOptimize | HOME
Close Window

Are Wall Street Analysts Bullish on EQT Stock?

Pittsburgh, Pennsylvania-based EQT Corporation (EQT) explores and produces natural gas, with a primary focus on the Appalachian Basin in Ohio, Pennsylvania, and West Virginia. Valued at $33.4 billion by market cap, EQT sells natural gas and natural gas liquids to marketers, utilities, and industrial customers through its pipelines.

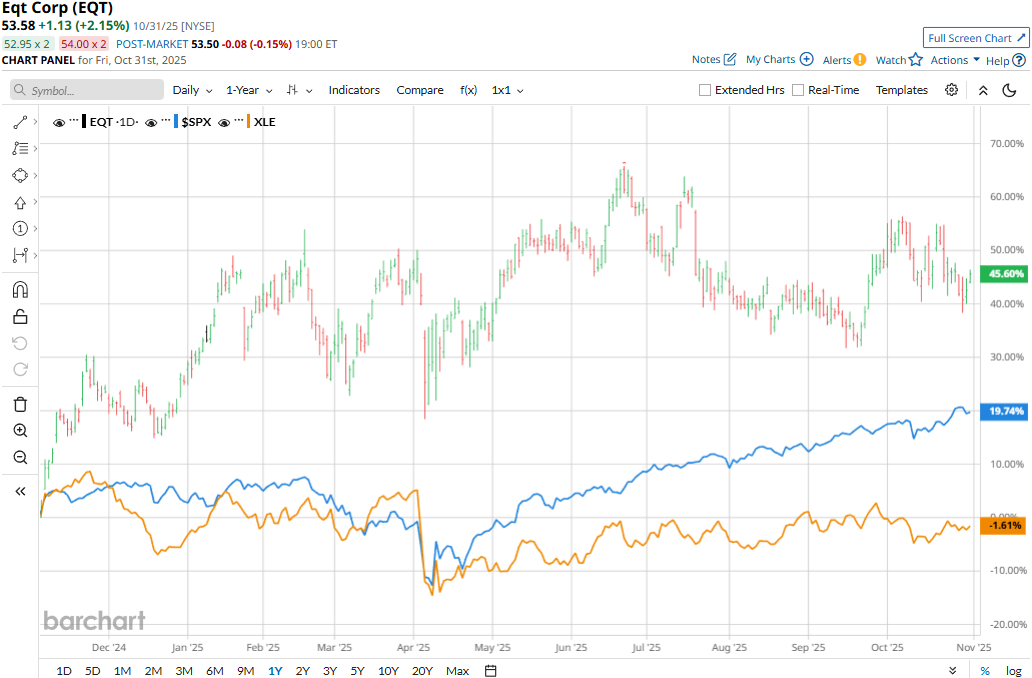
The energy giant has significantly outperformed the broader market over the past year. EQT stock prices have soared 16.2% in 2025 and 38.9% over the past 52 weeks, marginally lagging behind the S&P 500 Index’s ($SPX) 16.3% gains in 2025, while substantially outpacing SPX’s 17.7% returns over the past year.


Narrowing the focus, EQT has also outperformed the sector-focused Energy Select Sector SPDR Fund’s (XLE2.9% gains in 2025 and a marginal 10 bps uptick over the past 52 weeks.

www.barchart.com

Despite delivering better-than-expected results, EQT stock prices dropped nearly 4% in the trading session following the release of Q3 results on Oct. 21. During the quarter, the company’s sales volumes increased 9.1% year-over-year to 634.4 Bcfe, coming in at the high end of management’s guidance. Further, its average sales prices soared 39.7% year-over-year to $2.64 per Mcfe. Overall, the company’s topline soared 52.3% year-over-year to $1.96 billion, beating the consensus estimates by a notable margin. Meanwhile, its adjusted EPS skyrocketed 225% year-over-year to $0.52, surpassing the Street’s expectations by 10.6%. Following the initial dip, EQT stock prices remained in the green for three subsequent trading sessions.

For the full fiscal 2025, ending in December, analysts expect EQT to deliver an adjusted EPS of $2.84, up 76.4% year-over-year. Further, the company has a solid earnings surprise history. It has surpassed the Street’s bottom-line estimates in each of the past four quarters.

Among the 26 analysts covering the EQT stock, the consensus rating is a “Strong Buy.” That’s based on 19 “Strong Buys,” one “Moderate Buy,” and six “Holds.”

www.barchart.com

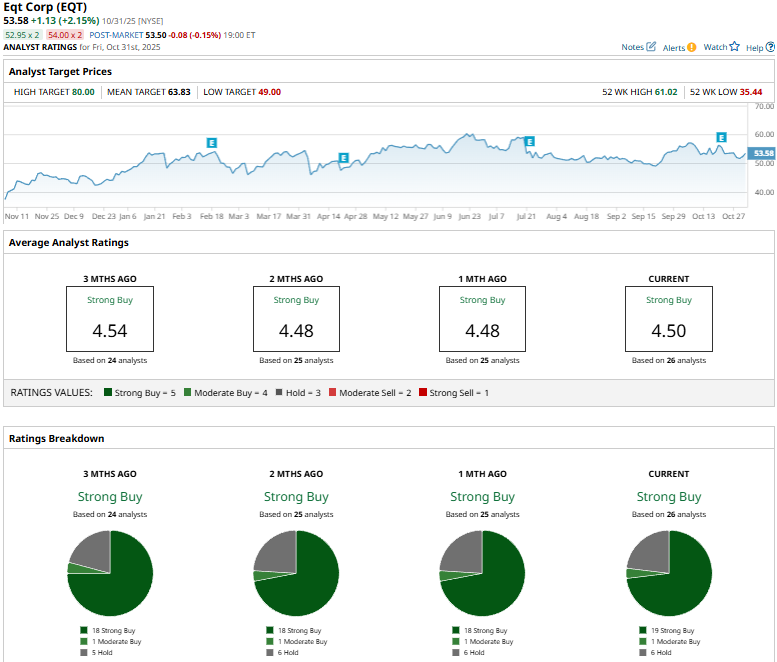
This configuration is slightly more bullish than a month ago, when 18 analysts gave “Strong Buy” recommendations.

On Oct. 23, Wells Fargo (WFC) analyst Sam Margolin reiterated an “Overweight” rating on EQT, but reduced the price target from $68 to $66.

EQT’s mean price target of $63.83 suggests a 19.1% upside potential. Meanwhile, the street-high target of $80 represents a notable 49.3% premium to current price levels.


On the date of publication, Aditya Sarawgi did not have (either directly or indirectly) positions in any of the securities mentioned in this article. All information and data in this article is solely for informational purposes. For more information please view the Barchart Disclosure Policy here.


More news from Barchart

Recent Quotes

View More
Symbol Price Change (%)
AMZN  229.46
+3.18 (1.41%)
AAPL  277.49
+1.57 (0.57%)
AMD  205.83
-9.22 (-4.29%)
BAC  52.64
+0.71 (1.37%)
GOOG  322.69
+4.22 (1.33%)
META  635.54
+22.49 (3.67%)
MSFT  478.14
+4.14 (0.87%)
NVDA  177.62
-4.93 (-2.70%)
ORCL  195.24
-5.04 (-2.52%)
TSLA  418.56
+0.79 (0.19%)
Stock Quote API & Stock News API supplied by www.cloudquote.io
Quotes delayed at least 20 minutes.
By accessing this page, you agree to the Privacy Policy and Terms Of Service.


IntelligentValue Home
Close Window

DISCLAIMER

All content herein is issued solely for informational purposes and is not to be construed as an offer to sell or the solicitation of an offer to buy, nor should it be interpreted as a recommendation to buy, hold or sell (short or otherwise) any security.  All opinions, analyses, and information included herein are based on sources believed to be reliable, but no representation or warranty of any kind, expressed or implied, is made including but not limited to any representation or warranty concerning accuracy, completeness, correctness, timeliness or appropriateness. We undertake no obligation to update such opinions, analysis or information. You should independently verify all information contained on this website. Some information is based on analysis of past performance or hypothetical performance results, which have inherent limitations. We make no representation that any particular equity or strategy will or is likely to achieve profits or losses similar to those shown. Shareholders, employees, writers, contractors, and affiliates associated with ETFOptimize.com may have ownership positions in the securities that are mentioned. If you are not sure if ETFs, algorithmic investing, or a particular investment is right for you, you are urged to consult with a Registered Investment Advisor (RIA). Neither this website nor anyone associated with producing its content are Registered Investment Advisors, and no attempt is made herein to substitute for personalized, professional investment advice. Neither ETFOptimize.com, Global Alpha Investments, Inc., nor its employees, service providers, associates, or affiliates are responsible for any investment losses you may incur as a result of using the information provided herein. Remember that past investment returns may not be indicative of future returns.

Copyright © 1998-2017 ETFOptimize.com, a publication of Optimized Investments, Inc. All rights reserved.