Houston, Texas-based Occidental Petroleum Corporation (OXY) is an energy company that acquires, explores, develops and produces oil and natural gas. With a market cap of $40.6 billion, the company also manufactures and markets a range of essential chemical products, further diversifying its presence across the energy and industrial sectors.
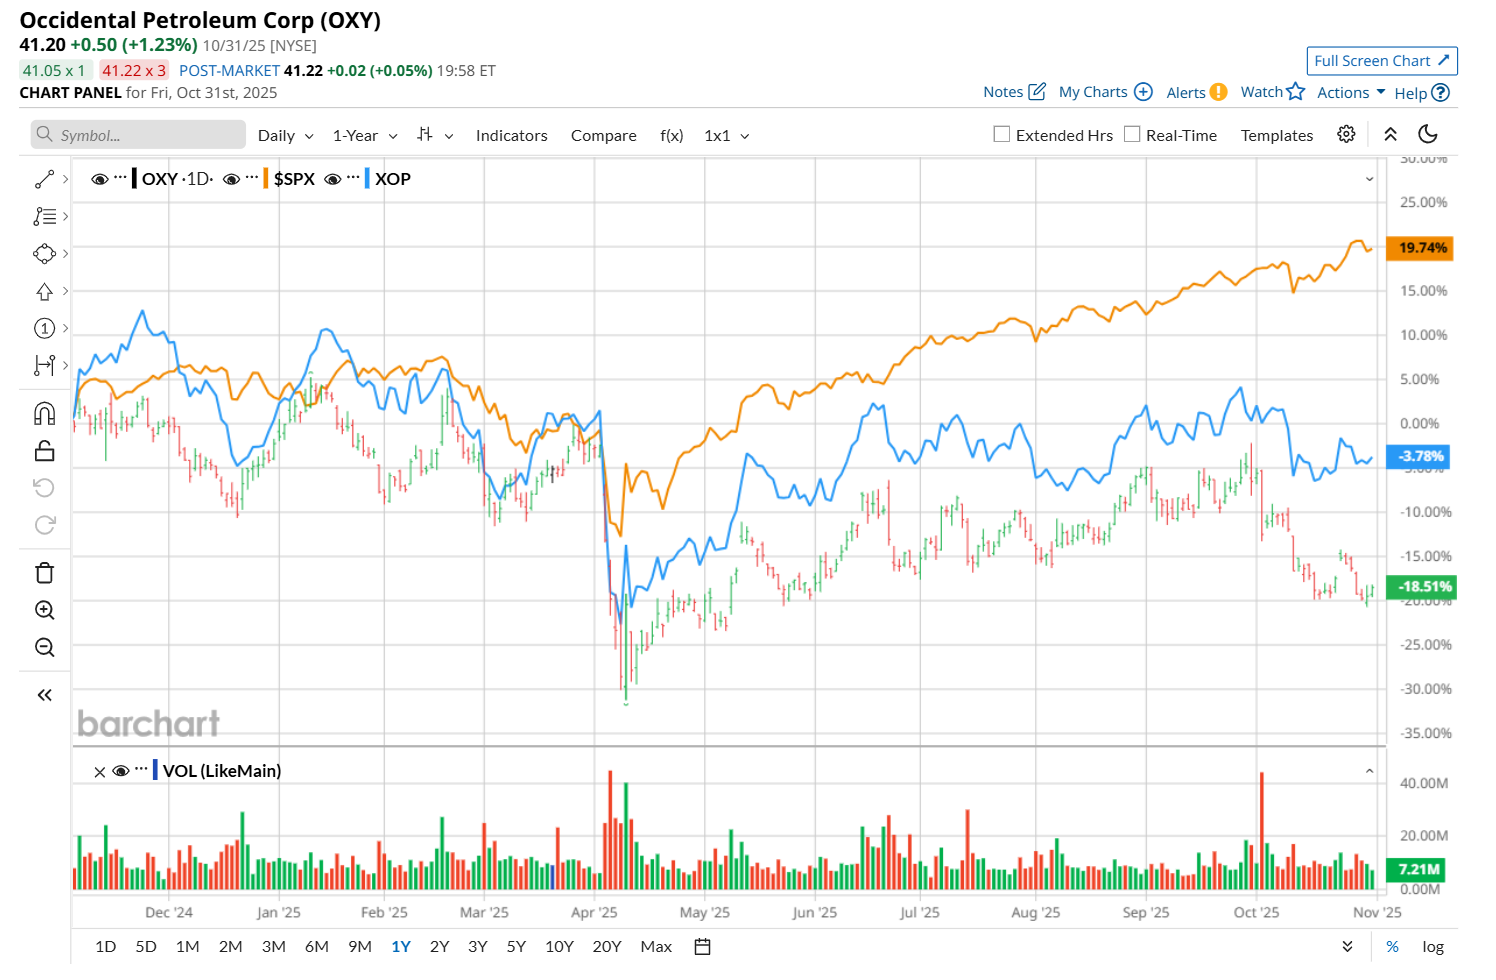
Shares of this energy company have lagged the broader market by a considerable margin over the past 52 weeks. OXY has declined 17.9% over this time frame, while the broader S&P 500 Index ($SPX) has gained 17.7%. Moreover, on a YTD basis, the stock is down 16.6%, compared to SPX’s 16.6% uptick.
Narrowing the focus, OXY has also underperformed the SPDR S&P Oil & Gas Exploration & Production ETF’s (XOP) 3.7% drop over the past 52 weeks and 4.2% downtick on a YTD basis.
On Aug. 6, Occidental Petroleum delivered mixed Q2 earnings results, and its shares surged 2.5% in the following trading session. On the downside, primarily due to lower oil and gas net sales, the company’s overall revenue declined 6.1% year over year to $6.5 billion, missing consensus estimates by a slight margin. Meanwhile, its adjusted EPS of $0.39 also fell by a notable 62.1% from the year-ago quarter, but topped analyst expectations by 39.3%, which might have cushioned the negatives. Adding to the uptick, management revealed that $3 billion in debt has already been repaid this year through asset sales, healthy cash flow, and proceeds from warrant exercises. This balance sheet improvement might have further bolstered investor confidence.
For the current fiscal year, ending in December, analysts expect OXY’s EPS to decline 36.7% year over year to $2.19. The company’s earnings surprise history is promising. It surpassed the consensus estimates in each of the last four quarters.
Among the 25 analysts covering the stock, the consensus rating is a "Hold,” which is based on four “Strong Buy,” one “Moderate Buy,” 17 "Hold,” and three "Strong Sell” ratings.
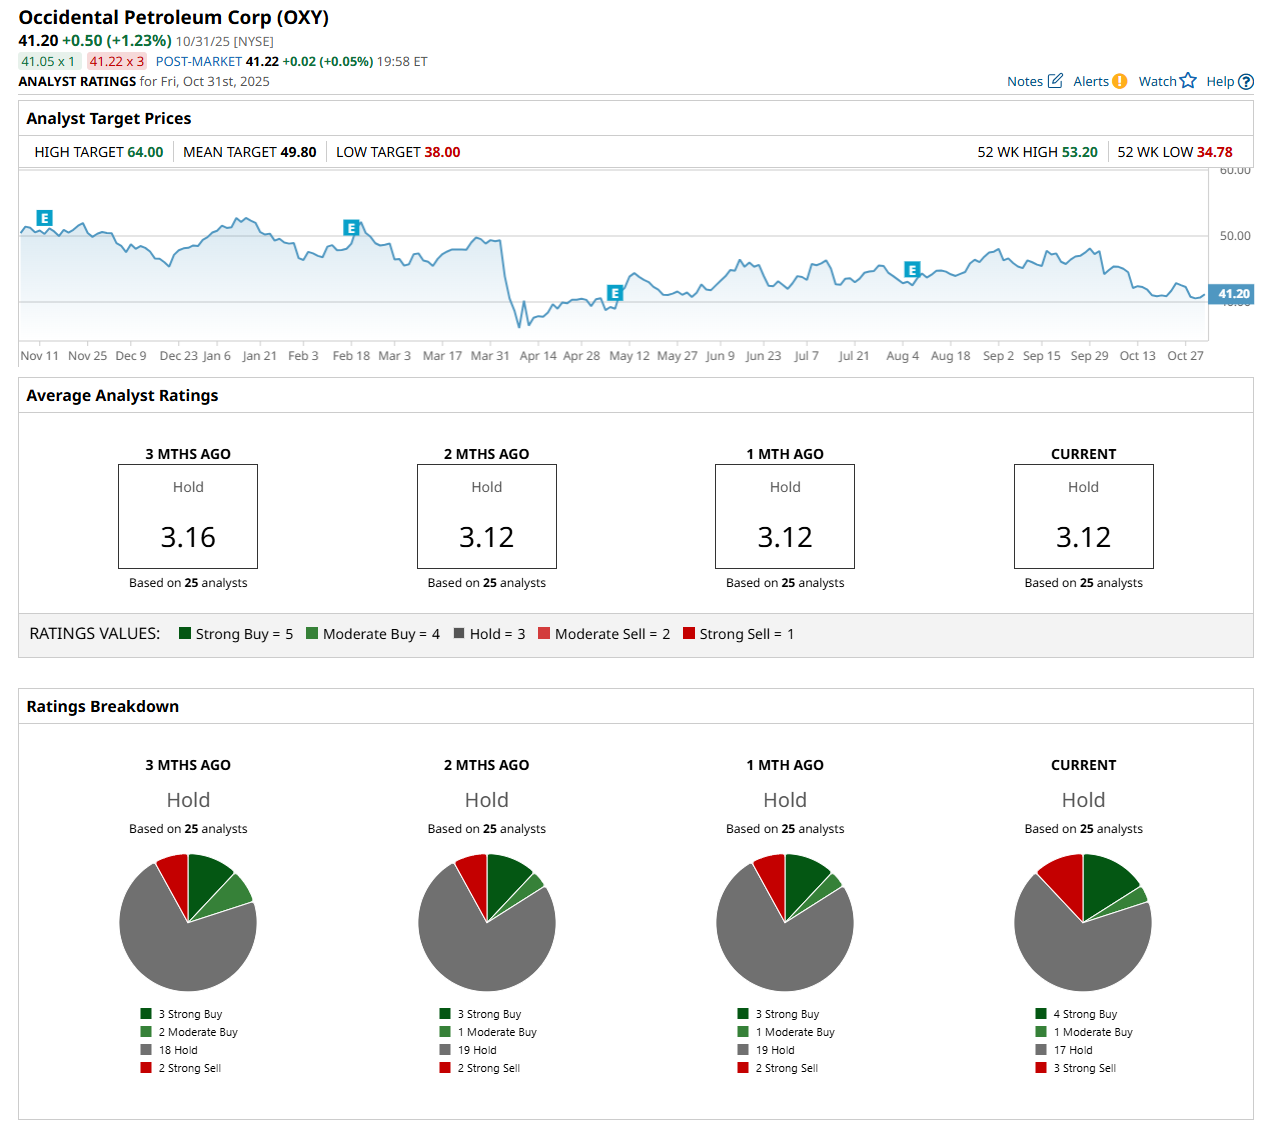
This configuration has changed since a month ago, with three analysts suggesting a “Strong Buy” rating and two recommending “Strong Sell.”
On Oct. 21, Piper Sandler Companies (PIPR) analyst Ryan Todd maintained a "Neutral" rating on OXY, but lowered its price target to $47, indicating a 14.1% potential upside from the current levels.
The mean price target of $49.80 represents a 20.9% premium from OXY’s current price levels, while the Street-high price target of $64 suggests an upside potential of 55.3%.
On the date of publication, Neharika Jain did not have (either directly or indirectly) positions in any of the securities mentioned in this article. All information and data in this article is solely for informational purposes. For more information please view the Barchart Disclosure Policy here.
More news from Barchart