Valued at a market cap of $183.4 billion, Applied Materials, Inc. (AMAT) provides manufacturing equipment, services, and software used to produce semiconductor chips, displays, and other advanced electronics. The Santa Clara, California-based company plays a critical role in enabling the development of cutting-edge technologies such as artificial intelligence, 5G, and electric vehicles by helping chipmakers and display manufacturers improve performance, efficiency, and scalability in their production processes.
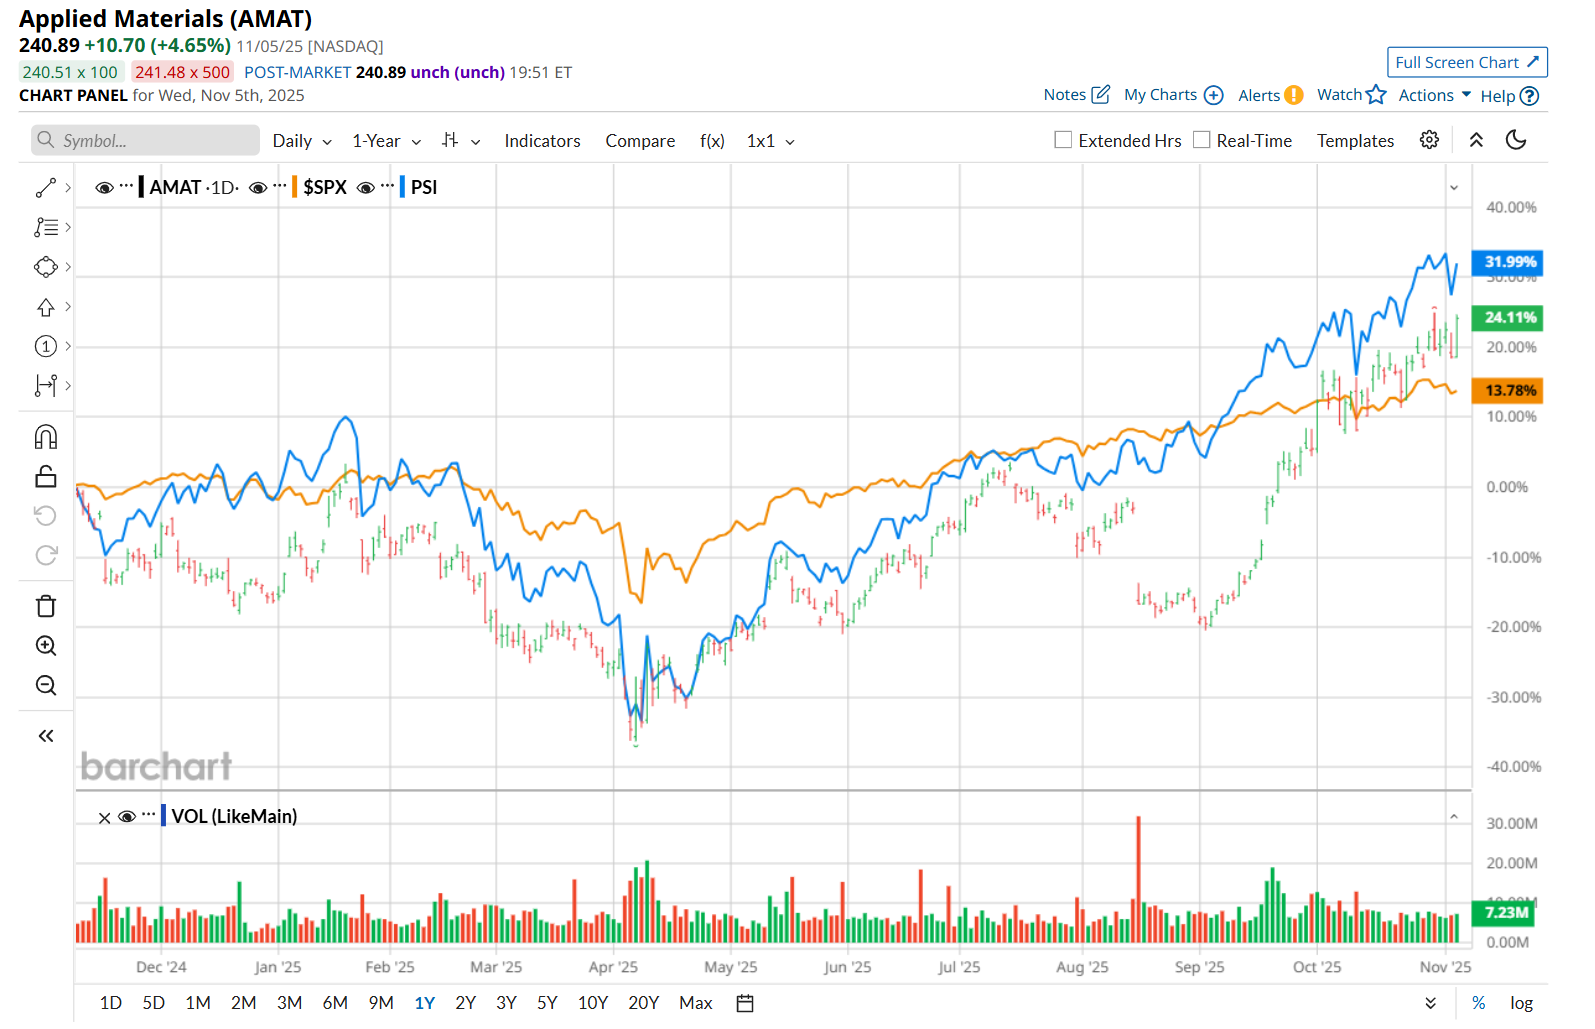
This tech company has outperformed the broader market over the past 52 weeks. Shares of AMAT have surged 29.2% over this time frame, while the broader S&P 500 Index ($SPX) has gained 17.5%. Moreover, on a YTD basis, the stock is up 48.1%, compared to SPX’s 15.6% return.
Zooming in further, AMAT has also outpaced the Invesco Semiconductors ETF’s (PSI) 34.5% uptick on a YTD basis. However, it has lagged behind PSI’s 39.8% rise over the past 52 weeks.
AMAT reported better-than-expected Q3 results on Aug. 14. The company’s revenue improved 7.7% year-over-year to $7.3 billion, and its adjusted EPS of $2.48 climbed 17% from the same period last year, both handily surpassing consensus estimates. However, despite the solid performance, its shares crashed 14.1% in the following trading session due to underwhelming Q4 guidance. The company expects adjusted EPS of $2.11 and revenue of $6.7 billion, both below analyst estimates.
For the current fiscal year, which ended in October, analysts expect AMAT’s EPS to grow 8.2% year over year to $9.36. The company’s earnings surprise history is promising. It topped the consensus estimates in each of the last four quarters.
Among the 35 analysts covering the stock, the consensus rating is a "Moderate Buy,” which is based on 18 “Strong Buy,” three “Moderate Buy,” 13 "Hold,” and one “Strong Sell” rating.
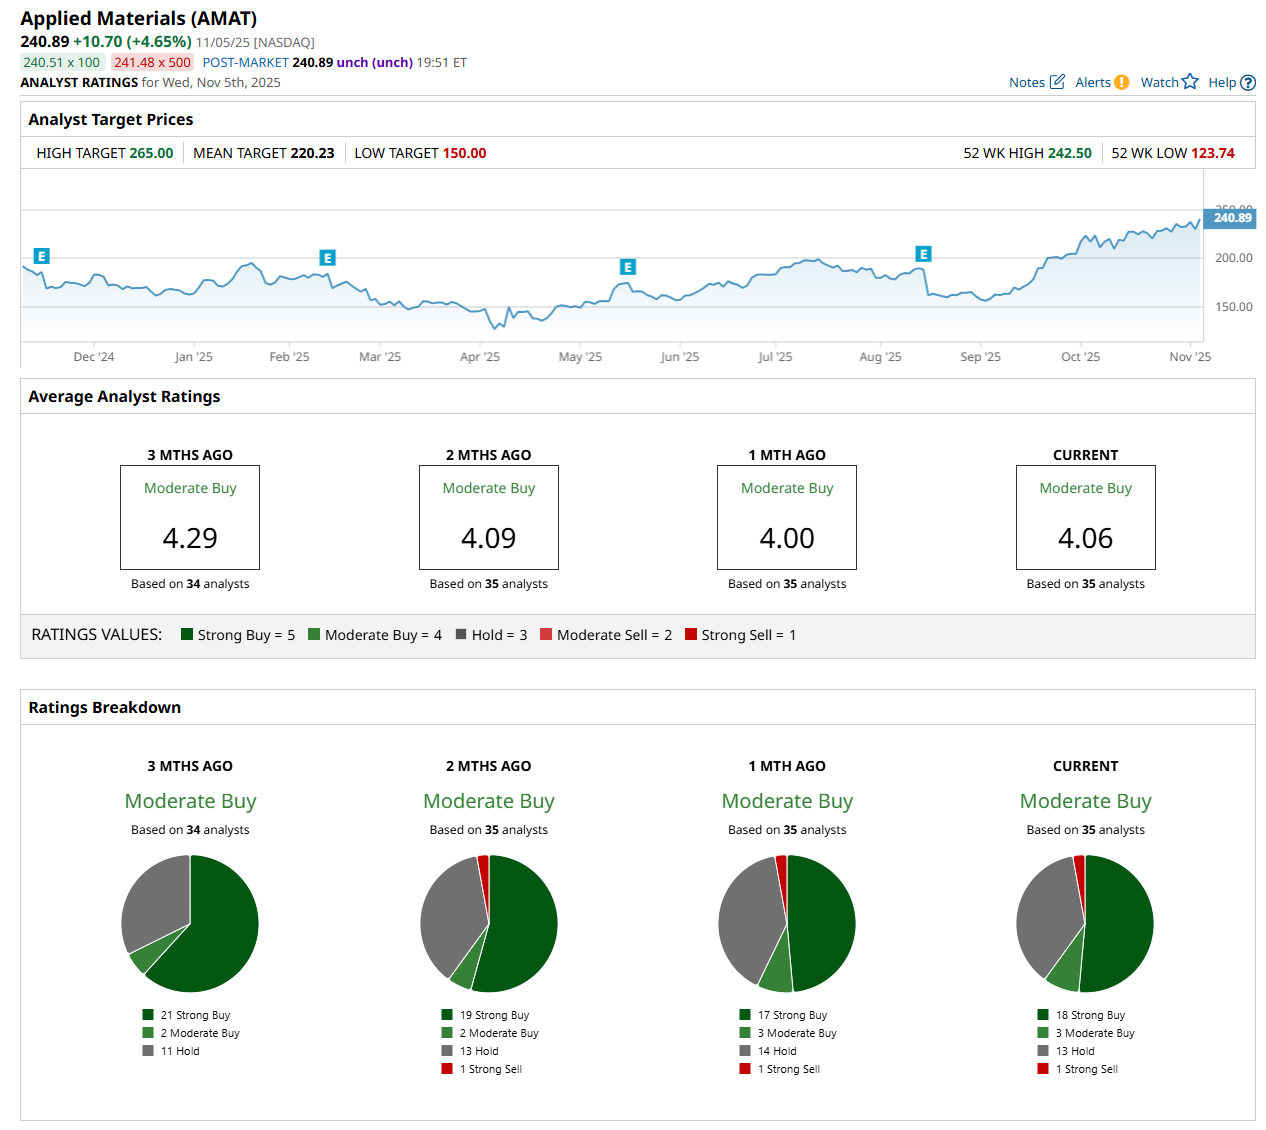
This configuration is slightly more bullish than a month ago, with 17 analysts suggesting a “Strong Buy” rating.
On Nov. 3, AllianceBernstein Holding L.P. (AB) analyst Stacy Rasgon maintained a "Buy" rating on AMAT and set a price target of $195.
While the company is trading above its mean price target of $220.23, its Street-high price target of $265 suggests an upside potential of 10%.
On the date of publication, Neharika Jain did not have (either directly or indirectly) positions in any of the securities mentioned in this article. All information and data in this article is solely for informational purposes. For more information please view the Barchart Disclosure Policy here.
More news from Barchart
- AbbVie Just Raised Its Dividend by 5.5%. Should You Buy ABBV Stock Here?
- 1 High-Risk, High-Reward Way to Trade Earnings with 0DTE Options
- Is This ‘Strong Buy’ Aerospace Stock a Giant Steal in 2025?
- Alex Karp Says ‘We Were Right, You Were Wrong’ as Palantir Delivers Record Revenue. Should You Buy PLTR Stock Here?


