- General Motors (GM) hit a new 10-year high in Monday morning trading.
- The automaker has strong technical momentum here.
- Shares have a 100% “Buy” technical opinion from Barchart and shares are up 32% over the past year.
- Fundamentals call for an earnings rebound next year and price targets go up to $100.
Today’s Featured Stock
Valued at $68.58 billion, auto giant General Motors (GM) has had a long and checkered history.
The company rose to dominate the U.S. industry. However, hit by the financial crisis, General Motors filed for bankruptcy. However, within a few months, the firm emerged from bankruptcy. The company is stepping up to embrace an electric future and gain a strong foothold in the fast-growing market. The firm’s own modular battery platform, the Ultium Drive system, will aid in the transition to an all-electric portfolio.
General Motors and its strategic partners produce, sell, and service cars, trucks, and parts under four core brands: Chevrolet, Buick, GMC, and Cadillac.
What I’m Watching
I found today’s Chart of the Day by using Barchart’s powerful screening functions to sort for stocks with the highest technical buy signals; superior current momentum in both strength and direction; and a Trend Seeker “buy” signal. I then used Barchart’s Flipcharts feature to review the charts for consistent price appreciation. GM checks those boxes. Since the Trend Seeker signaled a new “Buy” on Oct. 22, the stock has gained 9.09%.
Barchart Technical Indicators for General Motors
Editor’s Note: The technical indicators below are updated live during the session every 20 minutes and can therefore change each day as the market fluctuates. The indicator numbers shown below therefore may not match what you see live on the Barchart.com website when you read this report. These technical indicators form the Barchart Opinion on a particular stock.
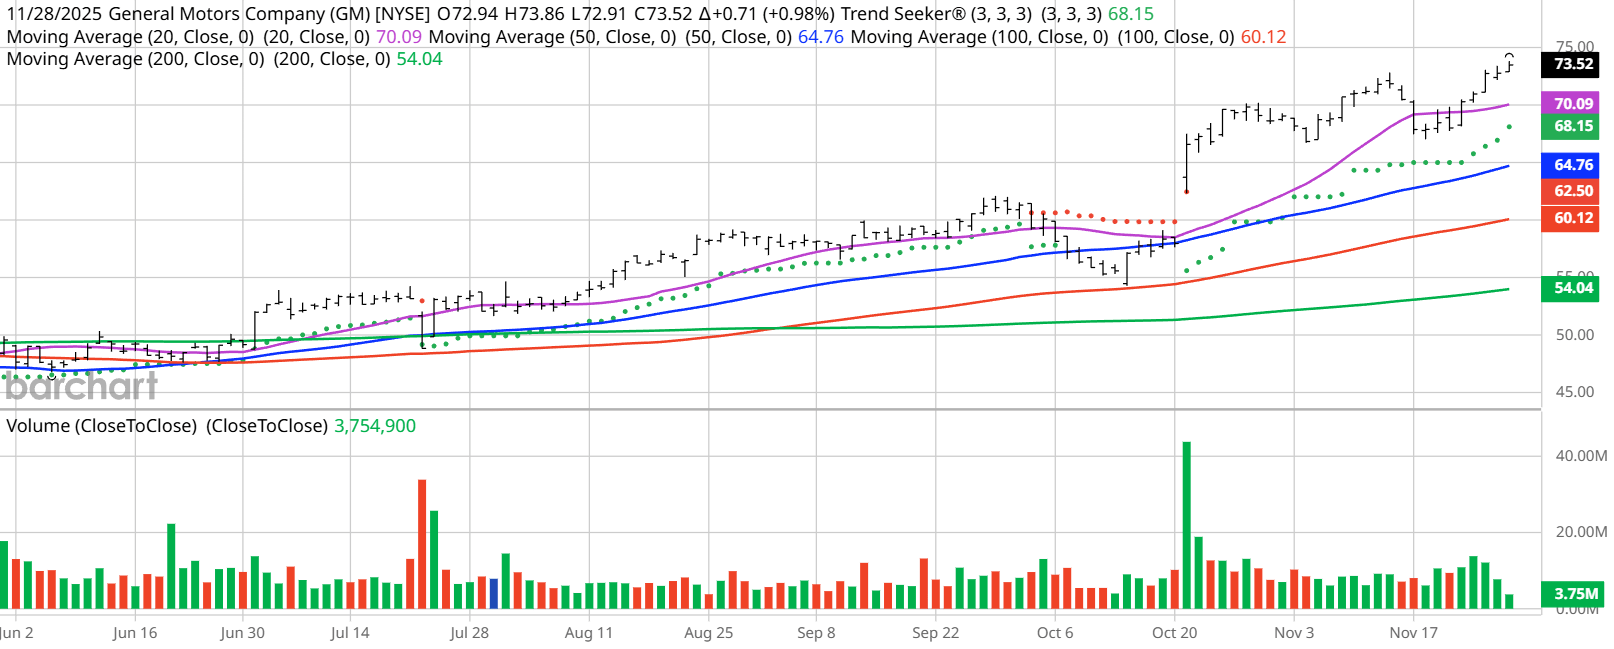
General Motors hit a 10-year high of $73.89 in morning trading on Dec. 1.
- GM has a Weighted Alpha of +53.86.
- General Motors has a 100% “Buy” opinion from Barchart.
- The stock gained 32.13% over the past year.
- GM has its Trend Seeker “Buy” signal intact.
- The stock recently traded at $73.81 with a 50-day moving average of $65.05.
- General Motors has made 12 new highs and gained 6.31% in the last month.
- Relative Strength Index (RSI) is at 69.97.
- There’s a technical support level around $73.00.
Don’t Forget the Fundamentals
- $68.58 billion market capitalization.
- Revenue is projected to decrease 1.02% this year but increase again by 0.30% next year.
- Earnings are estimated to decrease 3.47% this year but increase again by 11.19% next year.
Analyst and Investor Sentiment on General Motors
I don’t buy stocks because everyone else is buying, but I do realize that if major firms and investors are dumping stock, it’s hard to make money swimming against the tide.
It looks like Wall Street and individual investors like this stock.
- The Wall Street analysts tracked by Barchart have issued 14 “Strong Buys,” 2
“Moderate Buys,” 10 “Holds,” and 3 “Sell” opinions on the stock with price targets between $41 and $100. - Value Line rates the stock “Highest” with 3 to5-year price targets between $65 and $95.
- CFRA’s MarketScope Advisor rates it a “Buy” with a price target of $78.
- Morningstar thinks even with the stock’s recent runup, it’s fairly valued with a price target of $80.
- 2,868 investors following the stock on Motley Fool think it will beat the market while 1,069 think it won't.
- 248,150 investors monitor the stock on Seeking Alpha, which rates the stock a “Strong Buy.”
The Bottom Line on General Motors
Seeking Alpha sums it up: “GM showcases strong valuation and profitability, supported by solid momentum and favorable analyst revisions, making it a compelling buy. However, some growth metrics lag behind, warranting continued observation.”
Today’s Chart of the Day was written by Jim Van Meerten. Read previous editions of the daily newsletter here.
Additional disclosure: The Barchart of the Day highlights stocks that are experiencing exceptional current price appreciation. They are not intended to be buy recommendations as these stocks are extremely volatile and speculative. Should you decide to add one of these stocks to your investment portfolio it is highly suggested you follow a predetermined diversification and moving stop loss discipline that is consistent with your personal investment risk tolerance.
On the date of publication, Jim Van Meerten did not have (either directly or indirectly) positions in any of the securities mentioned in this article. All information and data in this article is solely for informational purposes. For more information please view the Barchart Disclosure Policy here.
More news from Barchart
- Apple Stock Looks Cheap Here Based on Strong FCF - Shorting OTM Put Options Has Worked
- As Robinhood Dives Into the Prediction Markets, Should You Buy, Sell, or Hold HOOD Stock?
- Morgan Stanley Just Named This Stock a Top Semiconductor Pick. Should You Buy Shares Now?
- AMD Stock Drops 15% in a Month: Should You Buy, Sell, or Hold?


