With a market cap of $20.5 billion, Coterra Energy Inc. (CTRA) is an independent oil and gas company focused on exploring, developing, and producing oil, natural gas, and natural gas liquids across the United States. Its major assets span the Permian Basin in Texas and New Mexico, the Marcellus Shale in Pennsylvania, and the Anadarko Basin in Oklahoma.
Companies valued at $10 billion or more are generally considered "large-cap" stocks, and Coterra Energy fits this criterion perfectly. The company also operates natural gas and saltwater gathering and disposal systems and markets its production to a wide range of industrial and energy customers.
Shares of the Houston, Texas-based company have fallen 10.2% from its 52-week high of $29.95. CTRA stock has increased 10.4% over the past three months, outpacing the broader iShares U.S. Oil & Gas Exploration & Production ETF's (IEO) 4.6% gain over the same time frame.
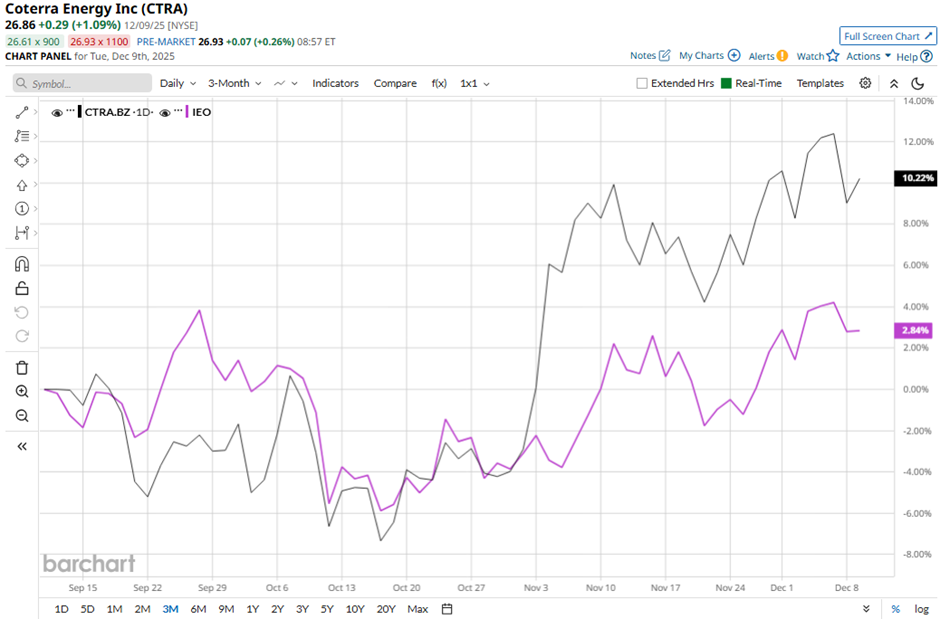
Longer term, shares of the company have soared 8.5% over the past 52 weeks, outperforming IEO's marginal return over the same time frame. However, CTRA stock is up 5.4% on a YTD basis, slightly lagging behind IEO's 5.8% rise.
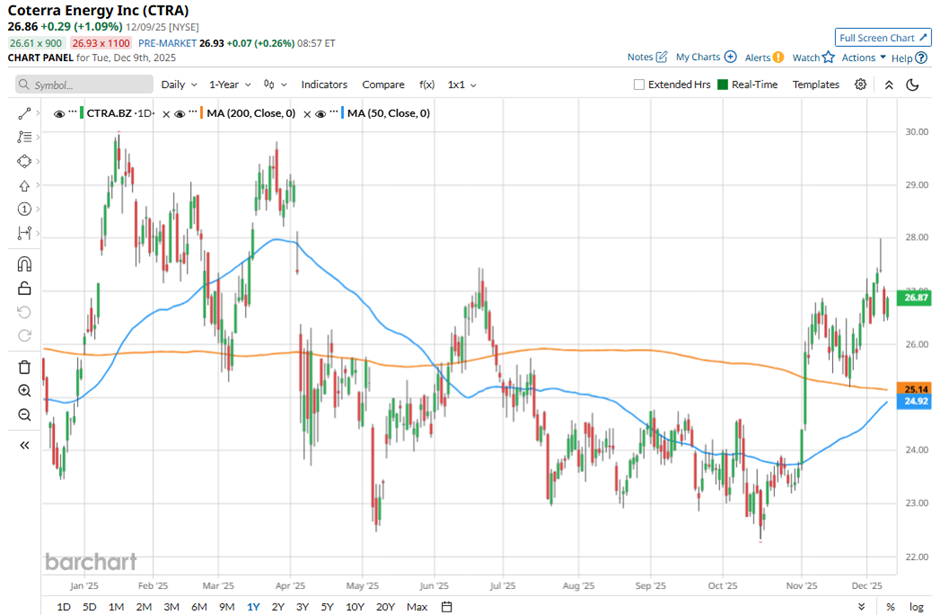
The stock has moved above its 50-day and 200-day moving averages since November.
Shares of CTRA climbed nearly 6% following its Q3 2025 results on Nov. 3 because production across all streams approached the high end of guidance, including 785 MBoepd total production, 166.8 MBopd oil, and 2,894.6 MMcfpd natural gas, each beating mid-points. Additionally, investors reacted positively to raised full-year 2025 production guidance, reaffirmed ~$2 billion expected 2025 free cash flow, and continued commitment to shareholder returns, including resuming share repurchases.
In comparison, rival Expand Energy Corporation (EXE) has outpaced CTRA stock. EXE stock has soared nearly 18% on a YTD basis and 20.9% over the past 52 weeks.
Despite the stock’s underperformance relative to its industry peers, analysts remain bullish on CTRA. It has a consensus rating of “Strong Buy” from the 25 analysts in coverage, and the mean price target of $32.46 is a premium of 20.8% to current levels.
On the date of publication, Sohini Mondal did not have (either directly or indirectly) positions in any of the securities mentioned in this article. All information and data in this article is solely for informational purposes. For more information please view the Barchart Disclosure Policy here.
More news from Barchart
- VICI Properties Hits a New 52-Week Low: Is It Time for Income Investors to Place a Bet?
- Salesforce Could Rebrand to Focus on Its AI Offerings. Should You Buy the Dip in CRM Stock Here?
- Creating a 39% “Dividend” on MRVL Stock Using Options
- Stock Index Futures Muted Amid Caution Ahead of Fed Rate Decision