Shelton, Connecticut-based Hubbell Incorporated (HUBB) is a leading manufacturer of electrical and utility infrastructure products. Valued at a market cap of $23.3 billion, the company provides a wide range of solutions, including wiring devices, connectors, lighting and controls, enclosures, and high-voltage utility components such as insulators, arresters, and grid-equipment hardware.
Companies worth $10 billion or more are typically classified as “large-cap stocks,” and HUBB fits the label perfectly, with its market cap exceeding this threshold, underscoring its size, influence, and dominance within the electrical equipment & parts industry. The company plays a critical role in supporting power transmission and distribution, grid modernization, electrification, and large-scale infrastructure development across North America and international markets.
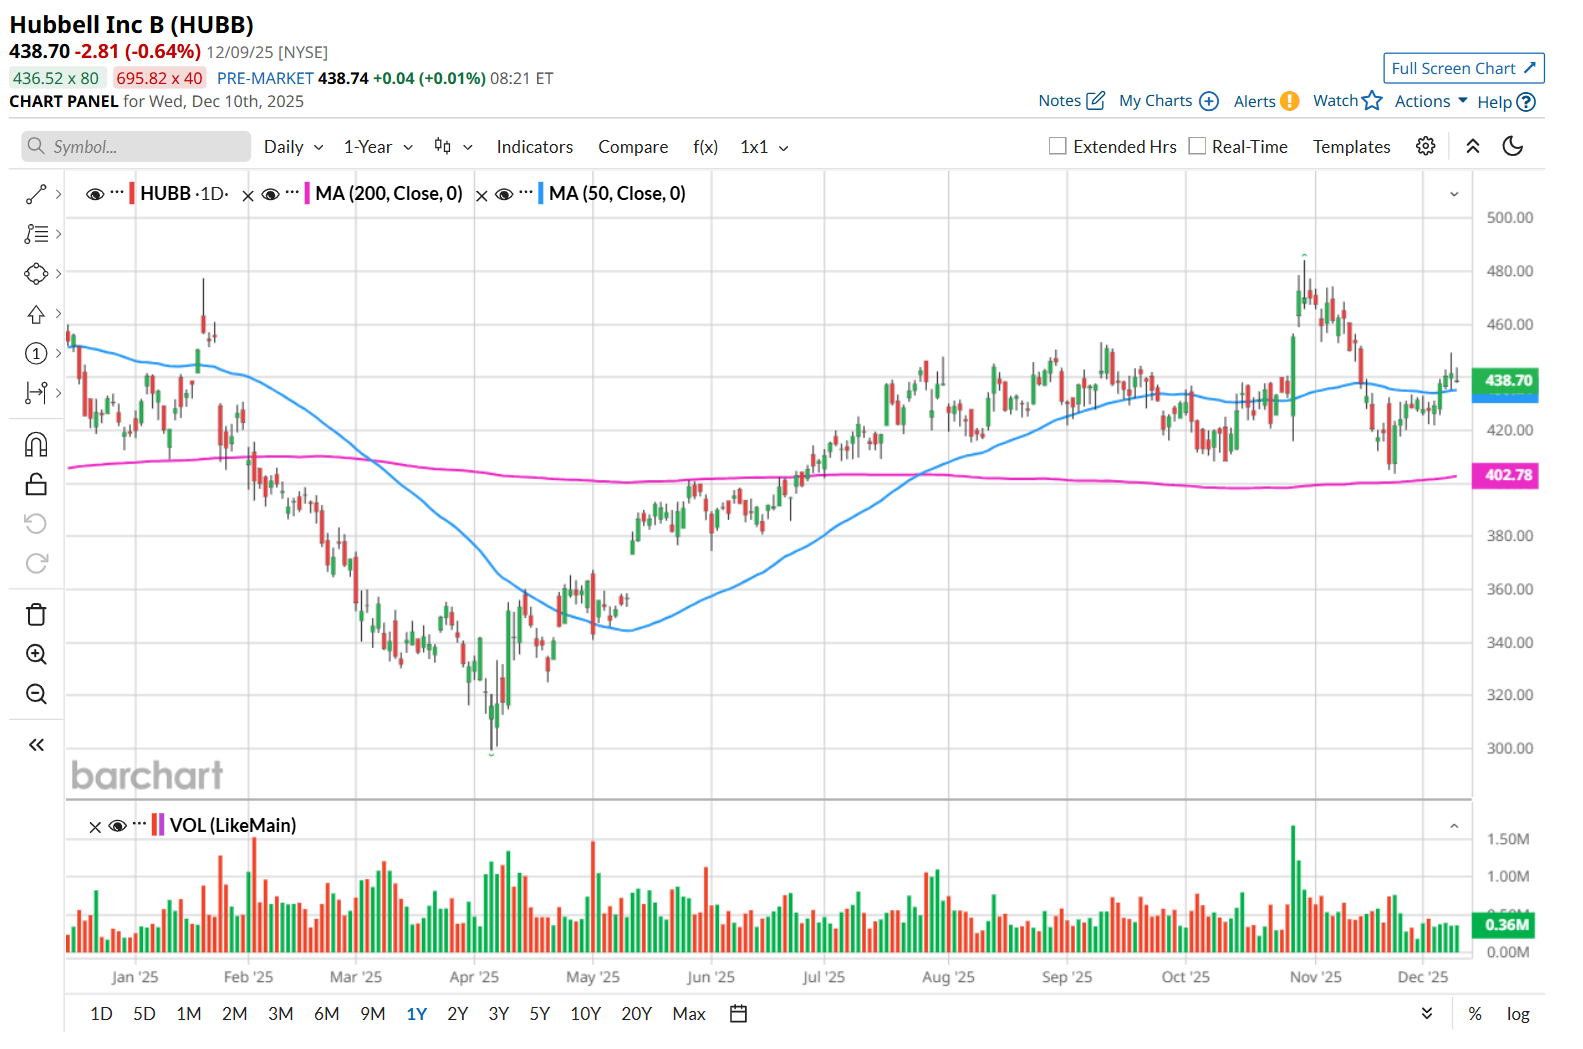
This electrical and utility infrastructure products manufacturer has dipped 9.4% below its 52-week high of $484.26, reached on Oct. 30. Shares of HUBB have declined marginally over the past three months, underperforming the State Street Industrial Select Sector SPDR ETF’s (XLI) 1.7% rise during the same time frame.
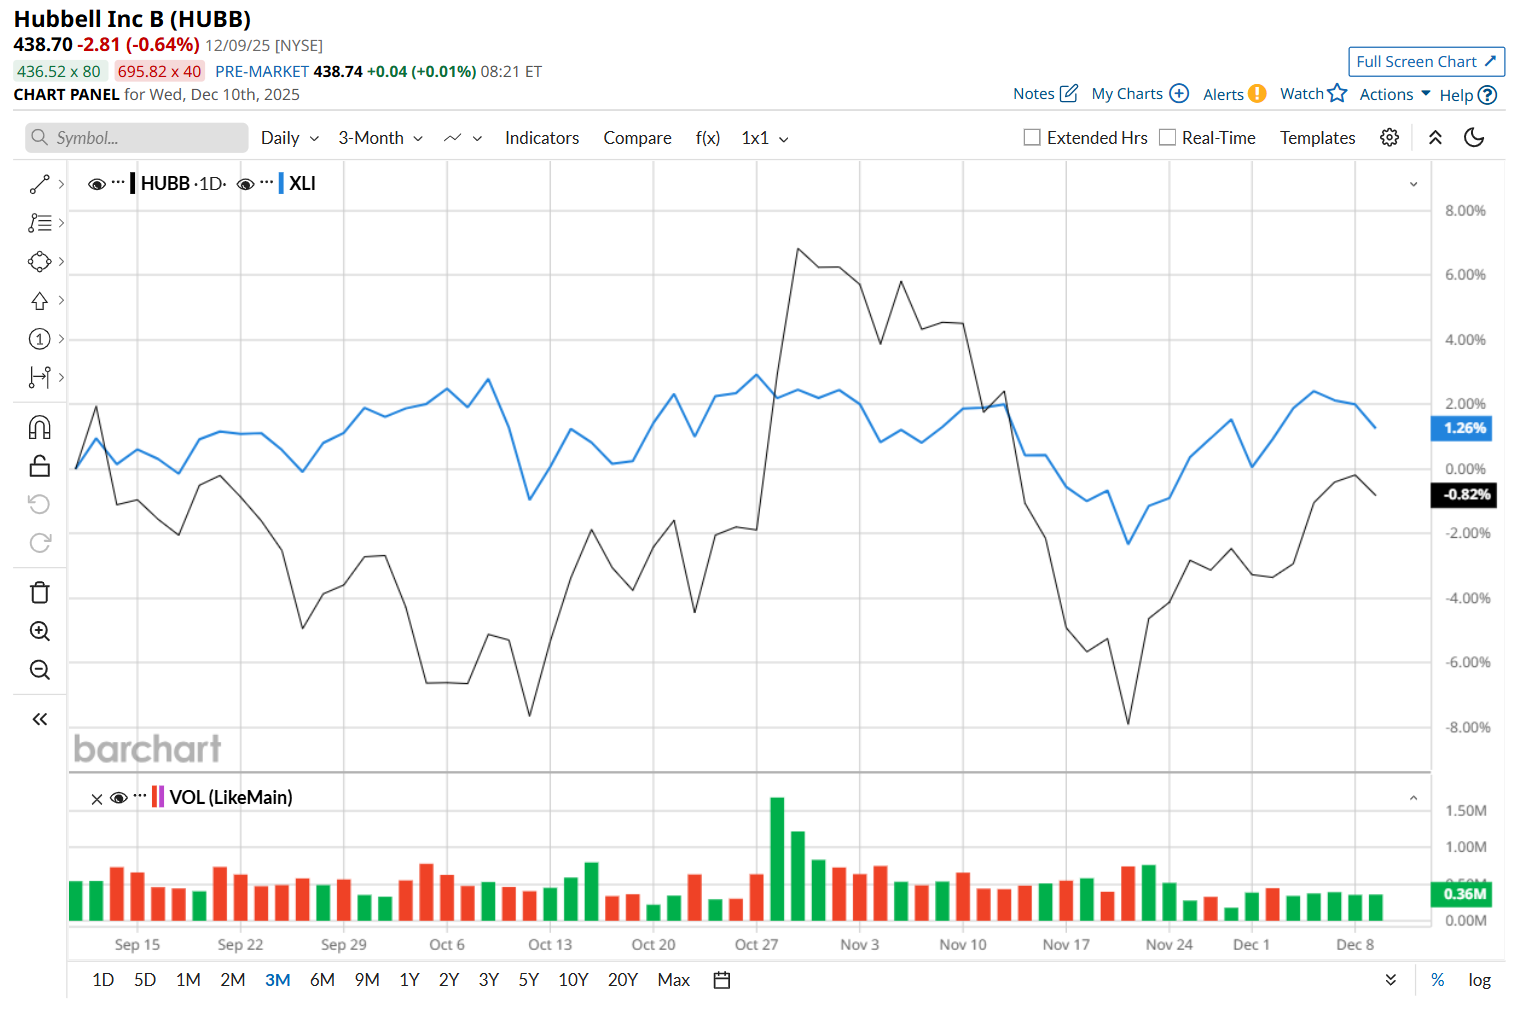
Moreover, on a YTD basis, shares of HUBB are up 4.7%, compared to XLI’s 16.8% return. In the longer term, HUBB has fallen 2.2% over the past 52 weeks, lagging behind XLI’s 10.8% uptick over the same time frame.
To confirm its recent bullish trend, HUBB has been trading above its 200-day moving average since late June and has remained above its 50-day moving average since early December.
On Oct. 28, shares of HUBB surged 4.9% after delivering mixed Q3 results. While the company's net sales increased 4.1% year-over-year to $1.5 billion, it missed analyst estimates by 2%. Nonetheless, its adjusted EPS climbed 12.1% from the year-ago quarter to $5.17 and topped consensus estimates of $4.99. Additionally, HUBB raised its fiscal 2025 adjusted EPS guidance in the range of $18.10 to $18.30, further bolstering investor confidence.
HUBB has also lagged behind its rival, nVent Electric plc (NVT), which soared 45.1% over the past 52 weeks and 58.4% on a YTD basis.
Despite HUBB’s recent underperformance, analysts remain moderately optimistic about its prospects. The stock has a consensus rating of "Moderate Buy” from the 14 analysts covering it, and the mean price target of $485.36 suggests a 10.6% premium to its current price levels.
On the date of publication, Neharika Jain did not have (either directly or indirectly) positions in any of the securities mentioned in this article. All information and data in this article is solely for informational purposes. For more information please view the Barchart Disclosure Policy here.
More news from Barchart
- VICI Properties Hits a New 52-Week Low: Is It Time for Income Investors to Place a Bet?
- Salesforce Could Rebrand to Focus on Its AI Offerings. Should You Buy the Dip in CRM Stock Here?
- Creating a 39% “Dividend” on MRVL Stock Using Options
- Stock Index Futures Muted Amid Caution Ahead of Fed Rate Decision