Headquartered in Chicago, Illinois, Kellanova (K) is a global manufacturer and marketer of snacks and convenience foods. Its diverse portfolio includes crackers, cereals, snack bars, savory snacks, frozen foods, noodles, and more.
With a market cap of approximately $29 billion, Kellanova firmly claims “large-cap” status and sells powerhouse brands like Kellogg’s, Cheez-It, Pringles, Eggo, RXBAR, and Morningstar Farms across more than 180 countries.
K shares are trading only slightly below their November high of $83.65 and have gained 5.6% over the past three months. Its performance matches the Dow Jones Industrial Average’s ($DOWI) 5.6% rise during the same period, implying K is keeping pace with the broader index.
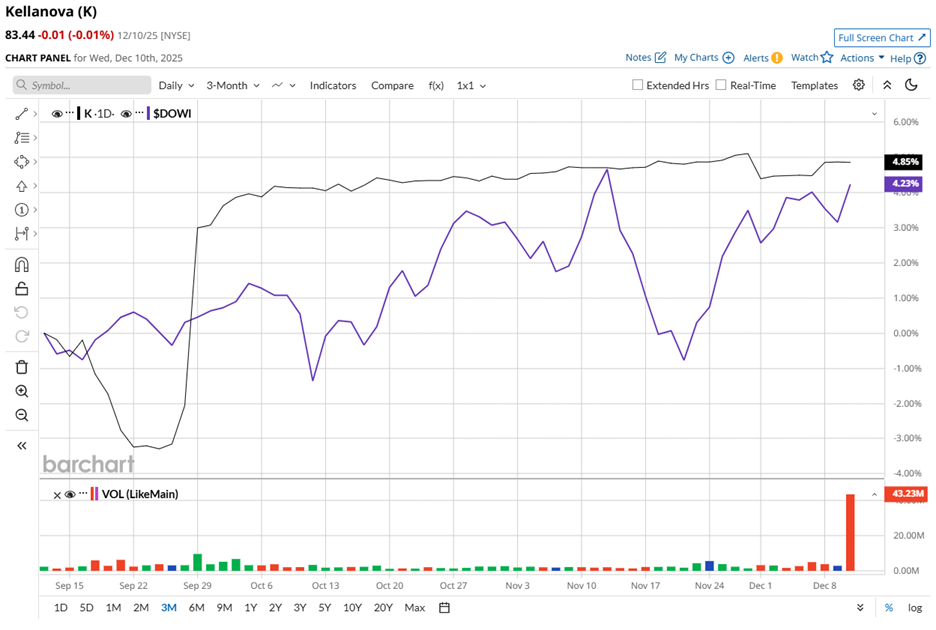
Over a longer horizon, K has climbed 3.4% over the past 52 weeks and has gained 3.1% year-to-date (YTD), while the Dow advanced a stronger 8.6% and 13% surge, respectively.
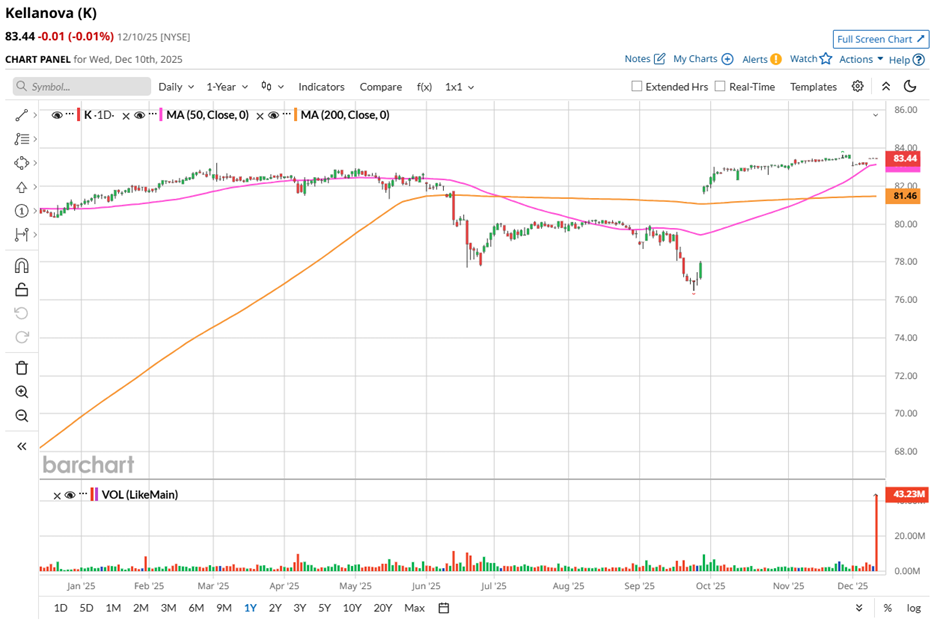
The technical setup also remains sound as K shares have traded consistently above its 50-day moving average of $83.14 and its 200-day moving average of $81.46 since October, reflecting healthy investor sentiment around the stock.
On Dec. 8, K shares edged slightly higher after Mars, a global leader in pet care, snacking, and food, secured final European Commission approval for its $36 billion acquisition of Kellanova, implying confidence that a Mars-backed future could unlock broader distribution muscle, stronger brand synergies, and deeper category penetration.
Once the deal closes, Kellanova’s snacking portfolio, which includes Pringles®, Cheez-It®, Pop-Tarts®, Rice Krispies Treats®, RXBAR®, and Kellogg’s international cereal brands, will join Mars’ powerhouse lineup of SNICKERS®, M&M’S®, TWIX®, SKITTLES®, EXTRA®, and KIND®, signaling a merger that could reshape the global snacking landscape.
Putting K’s steadiness into context, its rival, Constellation Brands, Inc. (STZ) has fallen 38.8% over the past 52 weeks and 32.8% YTD, making K’s relative stability appear even more resilient.
Still, analysts remain measured rather than bullish. Among 13 analysts, the consensus rating sits at “Hold,” with the stock already trading above its average price target of $83.42.
While analysts acknowledge the company’s stability and acquisition-driven potential, the consensus suggests they are looking for more convincing signs of sustained growth before taking a more bullish stance.
On the date of publication, Aanchal Sugandh did not have (either directly or indirectly) positions in any of the securities mentioned in this article. All information and data in this article is solely for informational purposes. For more information please view the Barchart Disclosure Policy here.
More news from Barchart
- Covered Call Screener Results For Dec 10th
- SoFi Stock Plunged After a Surprise Capital Raise: Should You Buy the Dip?
- Stocks Slip Before the Open as Oracle Dents Sentiment After Fed Cut
- Jamie Dimon Has Long Been Sounding the Economic Alarm. After the Fed’s Latest Rate Cut, Can You Still Bank on JPMorgan Stock?


