Atmos Energy Corporation (ATO), headquartered in Dallas, Texas, is a regulated natural gas provider with a market capitalization of nearly $27 billion, well above the $10 billion “large-cap” threshold. That said, its Distribution segment delivers gas to 3.4 million customers across eight states through 76,000 miles of pipelines.
The company’s Pipeline and Storage segment manages 5,700 miles of transmission lines, oversees five storage facilities in Texas, and provides transportation and ancillary services for third-party gas, reinforcing Atmos’s role as both a critical infrastructure operator and a reliable energy provider.
ATO stock trades roughly 7.5% below its November high of $180.65, yet it has eked out modest gains over the past three months. By comparison, State Street Utilities Select Sector SPDR ETF (XLU) rose 1.2% in the same period.
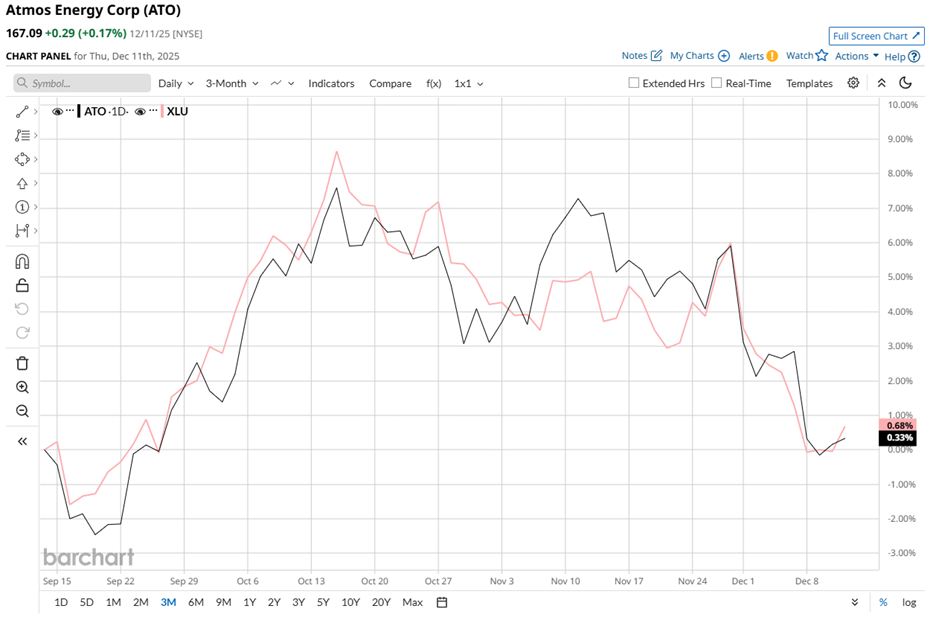
Over the past 52 weeks, ATO stock has climbed 19.3%, delivering a year-to-date (YTD) gain of almost 20%, outpacing XLU, which rose 10.9% over the past year and 13.7% YTD, underscoring Atmos’s relative strength and sustained investor confidence.
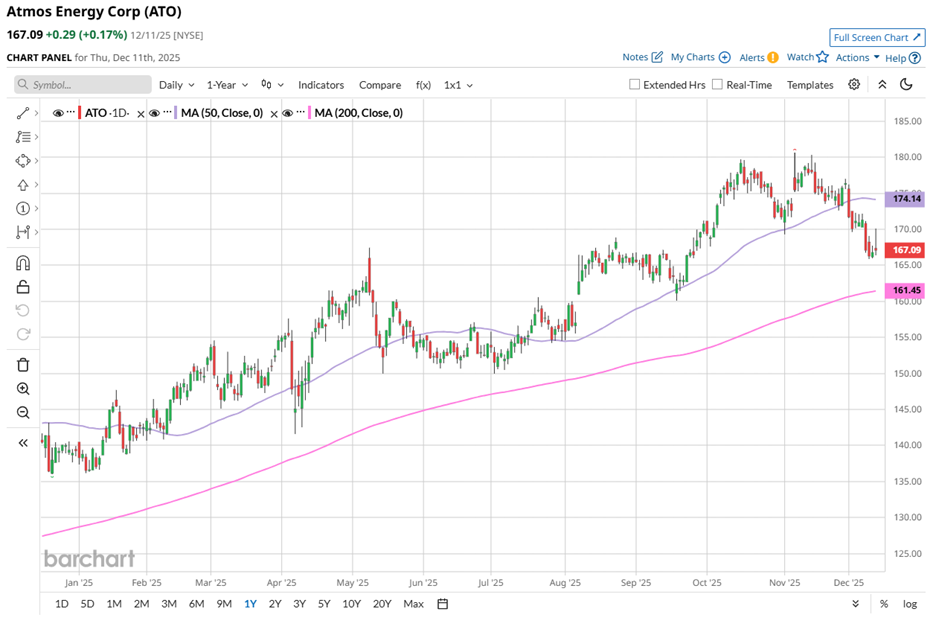
Technical indicators reinforce this momentum. The stock has consistently traded above its 200-day moving average of $161.45 since the start of the year, signaling long-term support. While ATO remained above its 50-day moving average of $174.14 since August, it dipped shortly in Dec, suggesting a short-term correction amid an otherwise bullish trend.
Following its Q4 fiscal 2025 earnings release on Nov. 5, Atmos Energy shares rose nearly 1.7% in the next trading session. It reported Q4 EPS of $1.07 and revenue of approximately $754.6 million, both surpassing estimates and demonstrating operational efficiency.
For the full fiscal year, Atmos generated $1.2 billion in net income with EPS of $7.46, underpinned by roughly $3.6 billion in capital expenditures, primarily directed toward system safety and reliability upgrades. Looking ahead, management issued optimistic FY2026 guidance, projecting EPS of $8.15–$8.35 and outlining a $4.2 billion capex plan.
Relative to peers, Atmos stands out. Its rival, New Jersey Resources Corporation (NJR), has declined 4.1% over the past 52 weeks and 1.6% YTD, highlighting Atmos’s operational strength and growth execution.
Despite sound fundamentals, analysts remain cautious, maintaining a “Hold” consensus rating from 14 analysts, though the stock’s mean price target of $175.91 suggests potential upside of 5.3% from current levels.
On the date of publication, Aanchal Sugandh did not have (either directly or indirectly) positions in any of the securities mentioned in this article. All information and data in this article is solely for informational purposes. For more information please view the Barchart Disclosure Policy here.
More news from Barchart
- 2 ‘Strong Buy’ Biotech Stocks With 208% to 329% Upside Potential
- Nasdaq Futures Slip as Broadcom Results Fail to Ease AI Fears, Fed Speak on Tap
- As Trump Takes a Stand Against Deere, How Should You Play the Blue-Chip Dividend Stock?
- Archer Aviation Is Bringing Its Flying Cars to Saudi Arabia. Is ACHR Stock a Buy Here?


