Valued at a market cap of $21.9 billion, Labcorp Holdings Inc. (LH) is a leading provider of comprehensive laboratory services. The company operates through its Diagnostics Laboratories and Biopharma Laboratory Services segments, offering a wide range of clinical tests, specialty diagnostics, and drug development solutions.
Companies valued at $10 billion or more are generally classified as “large-cap” stocks, and Labcorp Holdings fits this criterion perfectly. It serves a broad customer base, including healthcare providers, pharmaceutical and biotechnology companies, government organizations, employers, and consumers.
Shares of the Burlington, North Carolina-based company have decreased 9.9% from its 52-week high of $293.72. Shares of Labcorp Holdings have fallen 5.4% over the past three months, lagging behind the Health Care Select Sector SPDR Fund’s (XLV) 11.7% gain over the same time frame.
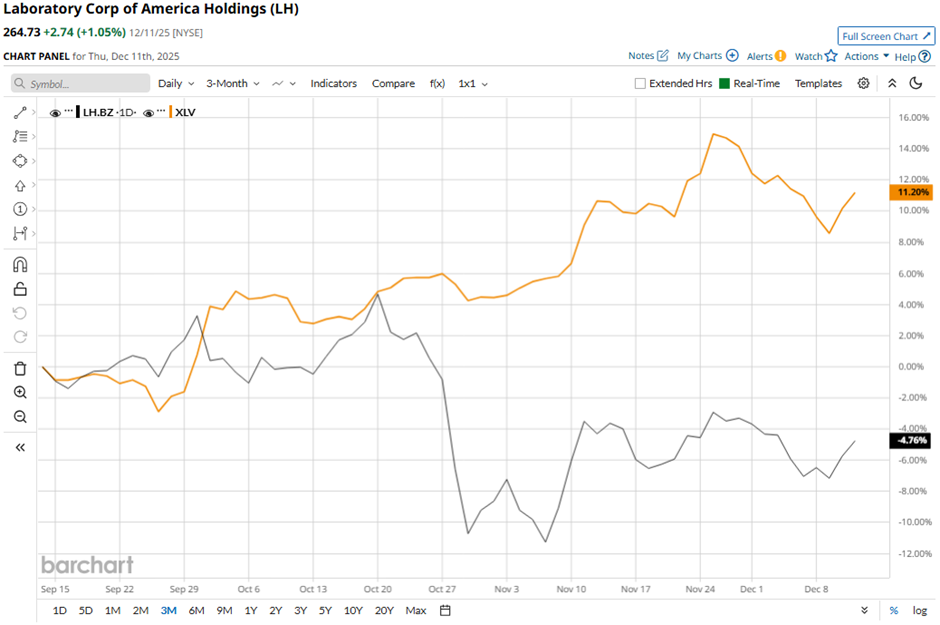
Longer term, LH stock is up 15.4% on a YTD basis, exceeding XLV’s 12.2% rise. Moreover, shares of the medical laboratory operator have soared 15.3% over the past 52 weeks, compared to XLV’s 9.4% return over the same time frame.
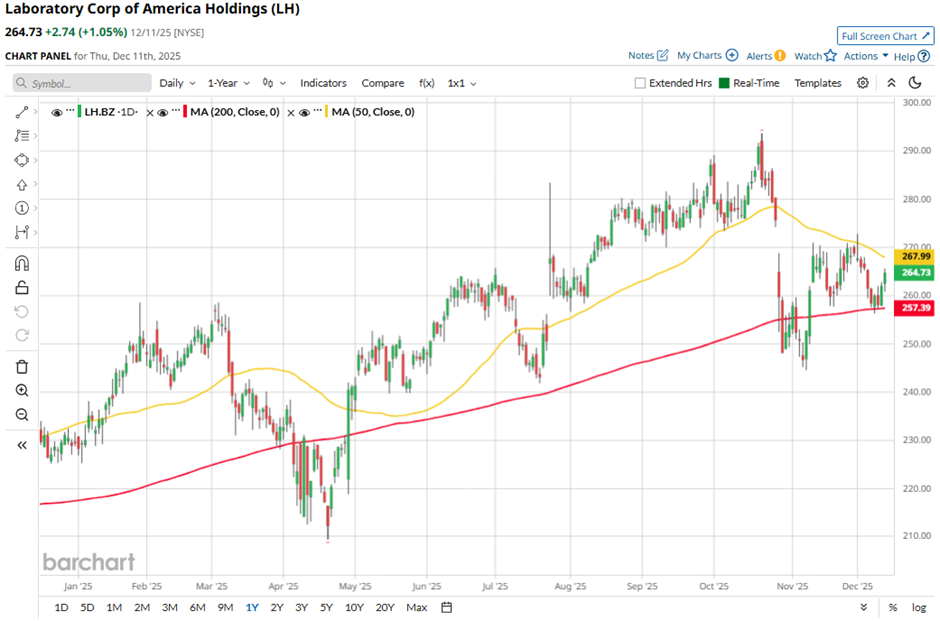
Despite a few fluctuations, the stock has been trading mostly above its 200-day moving average since last year.
Despite reporting better-than-expected Q3 2025 adjusted EPS of $4.18, shares of LH tumbled 5.8% on Oct. 28. The company cut its contract research unit’s annual revenue growth forecast to 5.7% - 7.1%, citing a prolonged funding crunch and delays in early-stage study starts. Labcorp also trimmed its full-year revenue growth outlook to 7.4% - 8%. Additionally, management warned that 2025 early-stage revenue would grow only low-single digits, compared with prior mid-single-digit expectations.
In contrast, rival Quest Diagnostics Incorporated (DGX) has outpaced LH stock. DGX stock has returned 20.4% on a YTD basis and 16.6% over the past 52 weeks.
Despite LH’s underperformance relative to its industry peers, analysts remain bullish about its prospects. The stock has a consensus rating of “Strong Buy” from 18 analysts in coverage, and the mean price target of $300.70 is a premium of 13.6% to current levels.
On the date of publication, Sohini Mondal did not have (either directly or indirectly) positions in any of the securities mentioned in this article. All information and data in this article is solely for informational purposes. For more information please view the Barchart Disclosure Policy here.
More news from Barchart
- Bob Iger Says ‘Creativity Is the New Productivity’ as Disney Bets $1 Billion on OpenAI and Entertainment Wars Heat Up
- This Little-Known Cloud Tech Stock Just Hit a New 52-Week High
- Can the Nasdaq Bull Keep Running? Here’s What Market Internals Are Telling Us Now.
- Adobe Impresses the Market With Strong Free Cash Flow - Is ADBE Stock Worth Buying?


