Valued at a market cap of $12.5 billion, The Clorox Company (CLX) is a consumer goods manufacturer based in Oakland, California. It is best known for its portfolio of household cleaning, disinfecting, and lifestyle products, which the company sells through iconic brands, including Clorox, Pine-Sol, Burt’s Bees, Fresh Step, Kingsford, Liquid-Plumr, and Hidden Valley.
Companies worth $10 billion or more are typically classified as “large-cap stocks,” and CLX fits the label perfectly, with its market cap exceeding this threshold, underscoring its size, influence, and dominance within the household & personal products industry. Widely recognized for its reliability and brand trust, the company leverages its distribution scale, innovation in cleaning solutions, and strong retail partnerships to maintain leadership in the industry.
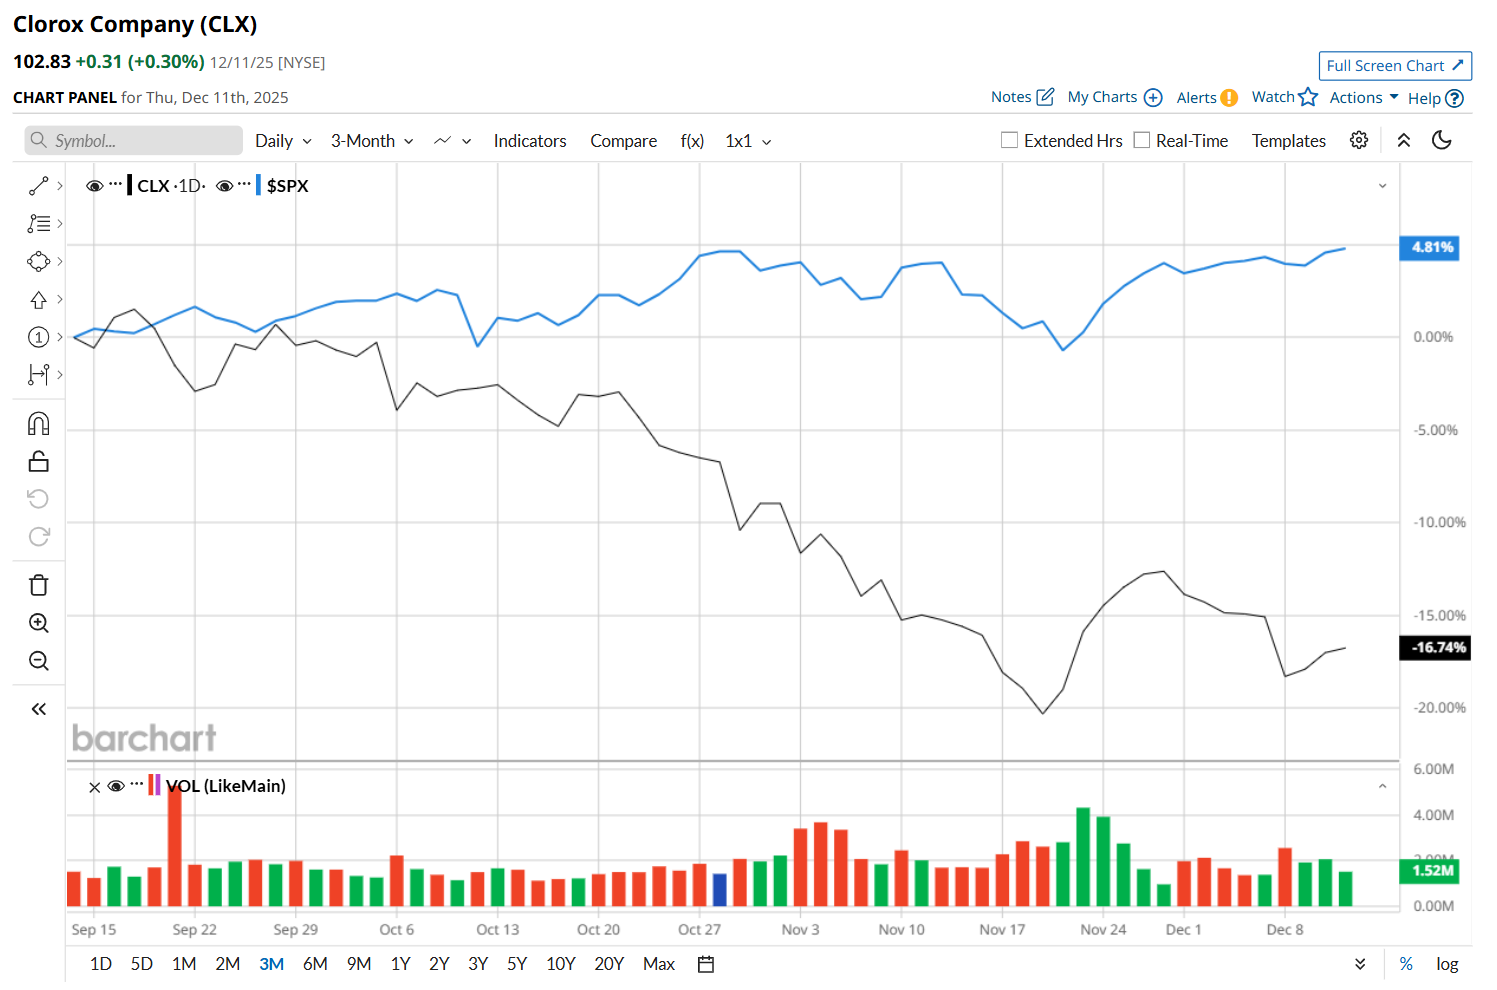
This consumer goods manufacturer has slipped 38.2% below its 52-week high of $166.35, reached on Dec. 16, 2024. Shares of CLX have declined 17.4% over the past three months, considerably underperforming the S&P 500 Index’s ($SPX) 4.8% rise during the same time frame.
Moreover, on a YTD basis, shares of CLX are down 36.7%, compared to SPX’s 17.3% return. In the longer term, CLX has fallen 37.6% over the past 52 weeks, notably lagging behind SPX’s 13.4% uptick over the same time frame.
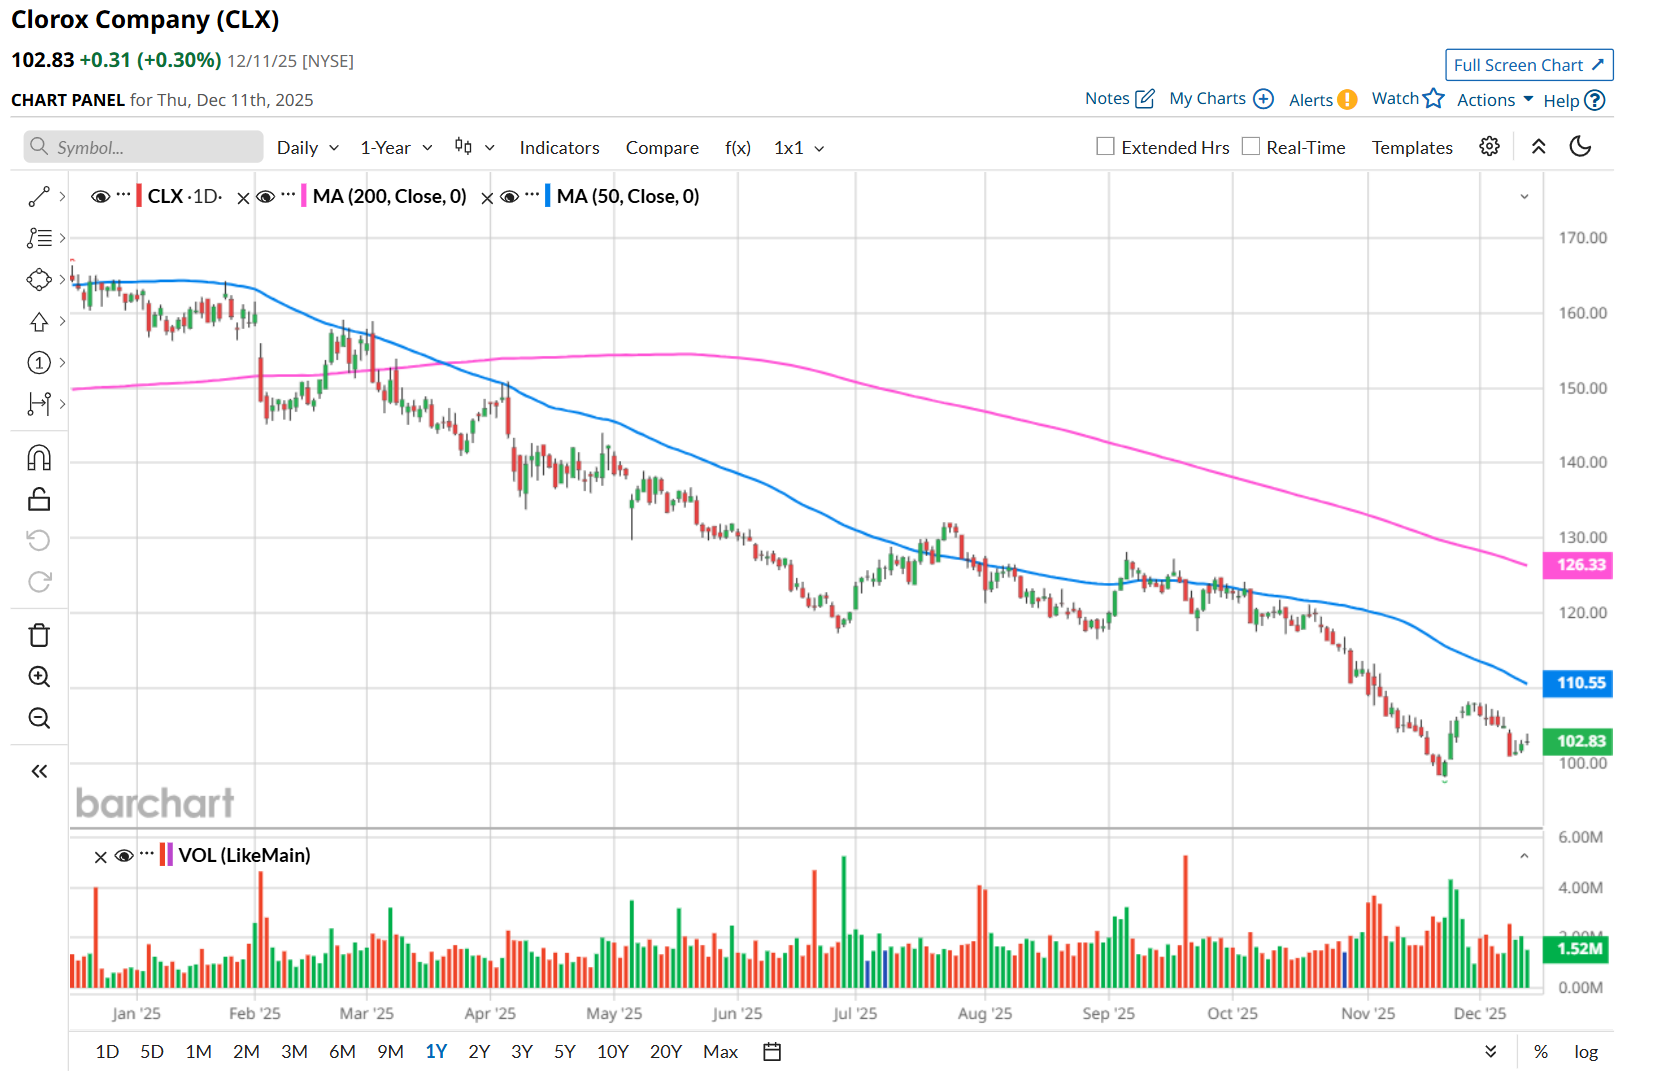
To confirm its bearish trend, CLX has been trading below its 200-day moving average since early March, and has remained below its 50-day moving average over the past year, with slight fluctuations.
On Nov. 3, shares of CLX plunged almost 3% after its Q1 earnings release, despite delivering better-than-expected results. The company’s revenue declined 18.9% year-over-year to $1.4 billion, but topped analyst expectations by 3.6%. Additionally, its adjusted EPS also fell 54.3% from the year-ago quarter to $0.85 largely due to lower net sales stemming from its ERP transition, yet it surpassed the consensus estimate of $0.78. The notable year-over-year declines in both revenue and earnings likely weighed on investor sentiment, contributing to the stock’s pullback.
CLX has also trailed behind its rival, The Procter & Gamble Company (PG), which declined 17.5% over the past 52 weeks and 16% on a YTD basis.
Looking at CLX’s recent underperformance, analysts remain cautious about its prospects. The stock has a consensus rating of "Hold” from the 18 analysts covering it, and the mean price target of $123.94 suggests a 20.5% premium to its current price levels.
On the date of publication, Neharika Jain did not have (either directly or indirectly) positions in any of the securities mentioned in this article. All information and data in this article is solely for informational purposes. For more information please view the Barchart Disclosure Policy here.
More news from Barchart


