With a market cap of $19 billion, J.B. Hunt Transport Services, Inc. (JBHT) is a leading provider of surface transportation, delivery, and logistics services in the United States. The company operates through five key segments: Intermodal; Dedicated Contract Services; Integrated Capacity Solutions; Final Mile Services; and Truckload, offering a wide range of freight and supply chain solutions.
Companies valued at more than $10 billion are generally considered “large-cap” stocks, and J.B. Hunt Transport fits this criterion perfectly. J.B. Hunt manages extensive fleets of trucks, trailers, and intermodal equipment to support diverse customer needs across multiple industries.
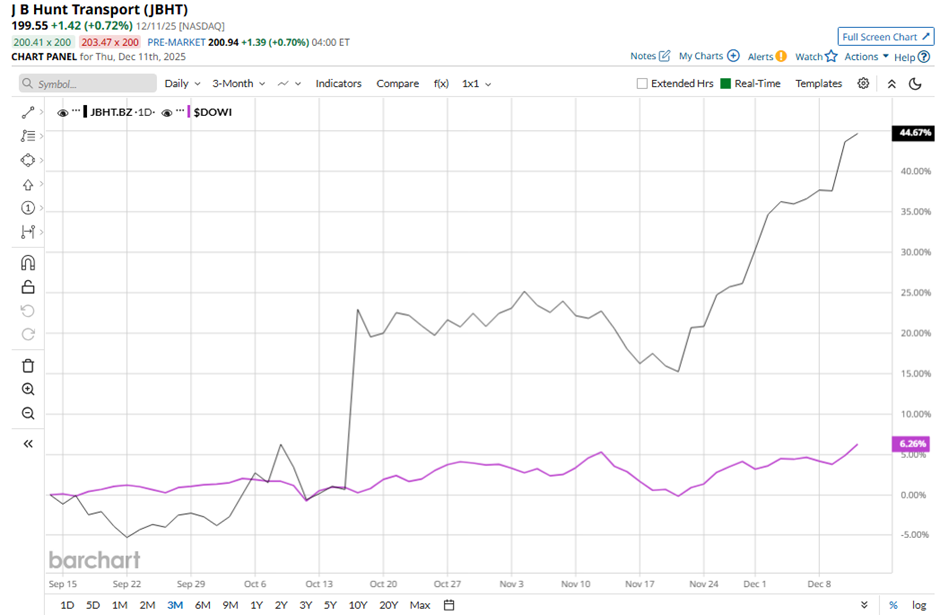
Shares of the Lowell, Arkansas-based company have fallen 2.4% from its 52-week high of $204.43. Over the past three months, its shares have surged 41.1%, outperforming the broader Dow Jones Industrials Average's ($DOWI) 5.6% return during the same period.
Longer term, JBHT stock is up 16.9% on a YTD basis, outpacing DOWI's 14.5% gain. However, shares of the trucking and logistics company have risen 9.6% over the past 52 weeks, slightly lagging behind DOWI’s 10.3% increase over the same time frame.
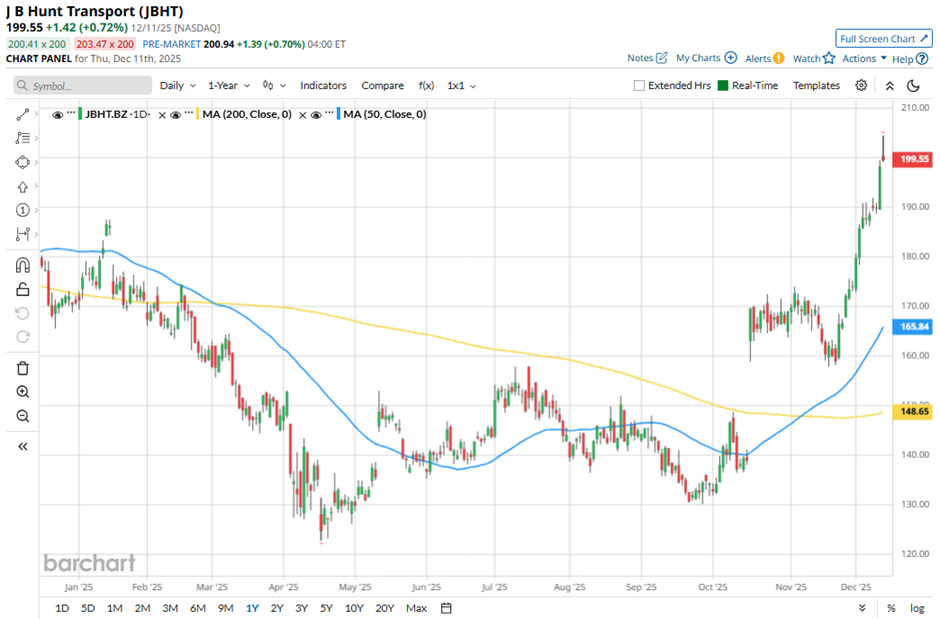
The stock has been in a bullish trend, consistently trading above its 50-day and 200-day moving averages since early October.
Shares of JBHT climbed 22.1% following its Q3 2025 results on Oct. 15. The company delivered stronger-than-expected revenue of $3.05 billion and EPS of $1.76. Investors responded positively to clear evidence of structural cost reductions and productivity improvements across key segments, including 12% operating income growth in Intermodal, 9% operating income growth in DCS, and a sharply narrowed loss in ICS.
In comparison, rival FedEx Corporation (FDX) has performed weaker than JBHT stock. FDX stock has gained 1.2% YTD and 1.3% over the past 52 weeks.
Despite the stock’s outperformance on a YTD basis, analysts remain cautiously optimistic about its prospects. JBHT stock has a consensus rating of “Moderate Buy” from 26 analysts in coverage, and as of writing, it is trading above the mean price target of $165.96.
On the date of publication, Sohini Mondal did not have (either directly or indirectly) positions in any of the securities mentioned in this article. All information and data in this article is solely for informational purposes. For more information please view the Barchart Disclosure Policy here.
More news from Barchart
- Adobe Impresses the Market With Strong Free Cash Flow - Is ADBE Stock Worth Buying?
- 2 ‘Strong Buy’ Biotech Stocks With 208% to 329% Upside Potential
- Nasdaq Futures Slip as Broadcom Results Fail to Ease AI Fears, Fed Speak on Tap
- As Trump Takes a Stand Against Deere, How Should You Play the Blue-Chip Dividend Stock?