With a market cap of $21.2 billion, New York-based Loews Corporation (L) provides commercial property and casualty insurance in the US and internationally. The company offers specialty insurance products, such as management & professional liability, coverage products, surety & fidelity bonds, risk management solutions, and more.
Companies worth $10 billion or more are generally described as “large-cap stocks.” Loews fits right into that category, with its market cap exceeding this threshold, reflecting its substantial size and influence in the insurance industry.
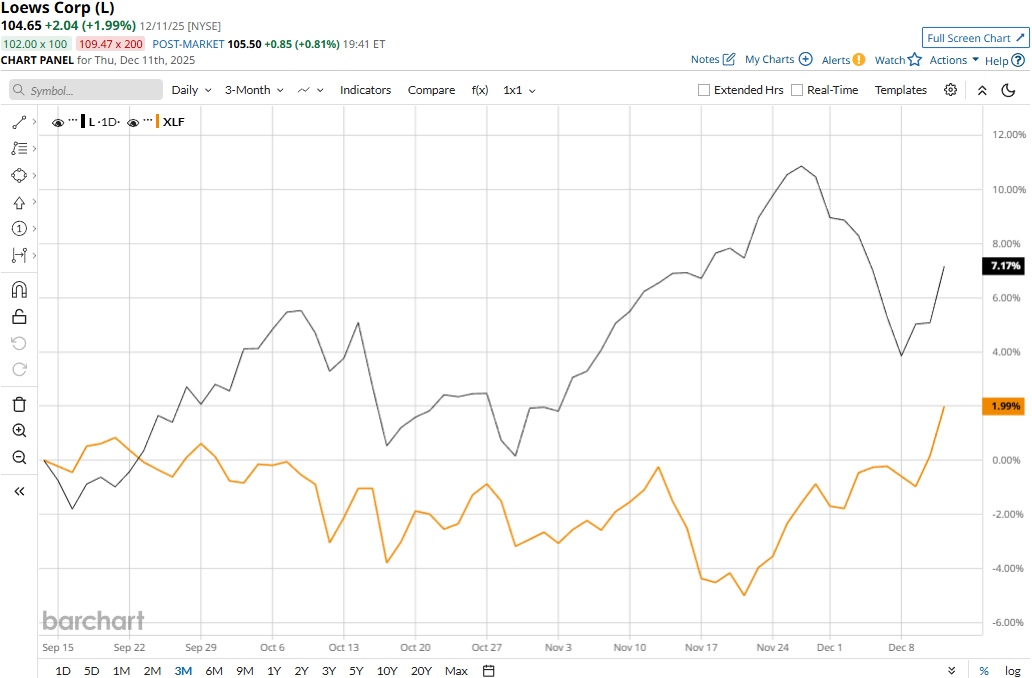
Loews touched its all-time high of $109.06 on Nov. 26 and is currently trading 4% below that peak. Meanwhile, Loews' stock prices have gained 6.7% over the past three months, notably outpacing the Financial Select Sector SPDR Fund’s (XLF) 1.6% uptick during the same time frame.
Loews’ performance has remained impressive over the longer term as well. Its stock prices have soared 23.6% on a YTD basis and 23.5% over the past 52 weeks, significantly outpacing XLF’s 13.5% gains in 2025 and 10.2% returns over the past year.
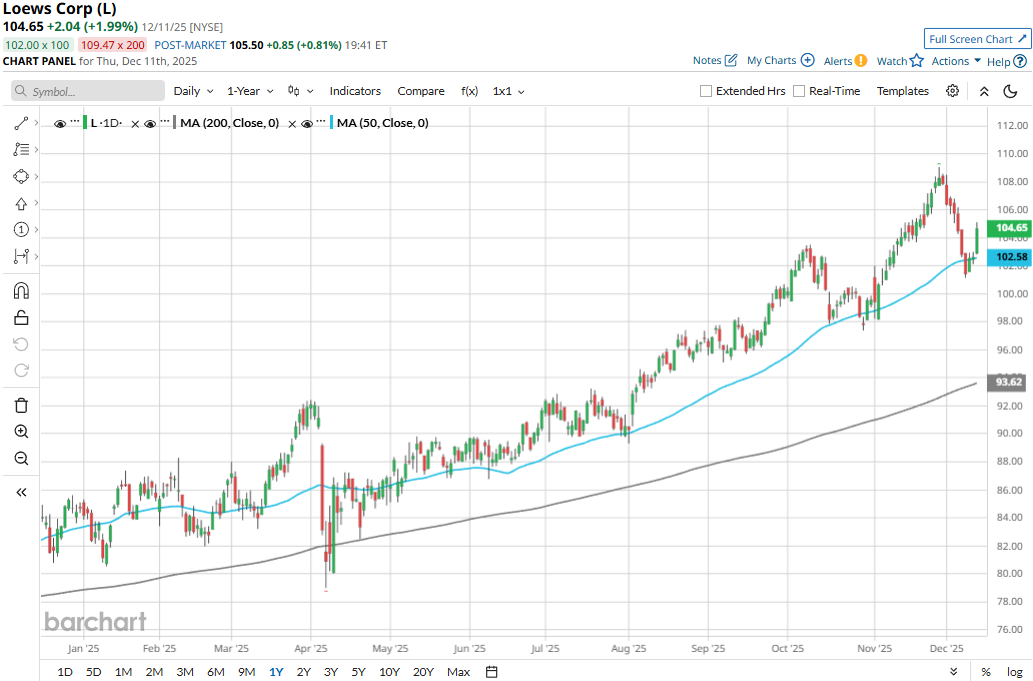
Further, the stock has traded mostly above its 50-day and 200-day moving averages over the past year, with some fluctuations, underscoring its bullish trend.
Loews’ stock prices observed a marginal dip in the trading session following the release of its Q3 results on Nov. 3. The company owns a majority stake in CNA Financial Corporation (CNA), which observed a notable surge in property and casualty underwriting results driven by lower catastrophe losses and improved underlying underwriting results, and higher net investment income. Further, the company also observed strength in its other businesses, leading to 4.6% year-over-year growth in overall revenues to $4.7 billion.
Meanwhile, Loews observed a notable improvement in its combined ratio, leading to an improvement in core income. Overall, the company’s net income soared 25.7% year-over-year to $504 million. Following the initial dip, Loews’ stock prices maintained a positive momentum for nine subsequent trading sessions.
When compared to its peer, Loews has notably outperformed Cincinnati Financial Corporation’s (CINF) 14.8% gains on a YTD basis and 8.8% returns over the past 52 weeks.
On the date of publication, Aditya Sarawgi did not have (either directly or indirectly) positions in any of the securities mentioned in this article. All information and data in this article is solely for informational purposes. For more information please view the Barchart Disclosure Policy here.
More news from Barchart
- As Trump Takes a Stand Against Deere, How Should You Play the Blue-Chip Dividend Stock?
- Archer Aviation Is Bringing Its Flying Cars to Saudi Arabia. Is ACHR Stock a Buy Here?
- USA Rare Earth Just Revved up Its Commercial Timeline. Should You Buy USAR Stock Here?
- Robinhood Stock Gets Dragged Down by the Crypto Selloff. Should You Buy the Dip?


