Headquartered in Stamford, Connecticut, Synchrony Financial (SYF) offers digitally driven consumer financial services, including private-label and co-brand credit cards, installment loans, and savings products through Synchrony Bank.
Boasting a market cap of approximately $30.5 billion, the company comfortably surpasses the $10 billion threshold that defines “large-cap” status and leverages its scale to support wide-ranging credit programs across major retailers and service providers.
Currently, SYF stock trades just slightly below its 52-week high of $86.22 made in Dec, underscoring persistent investor confidence. Plus, its 12.7% gain in the past three months easily beats the State Street Financial Select Sector SPDR ETF’s (XLF) 1.6% rise during the same stretch.
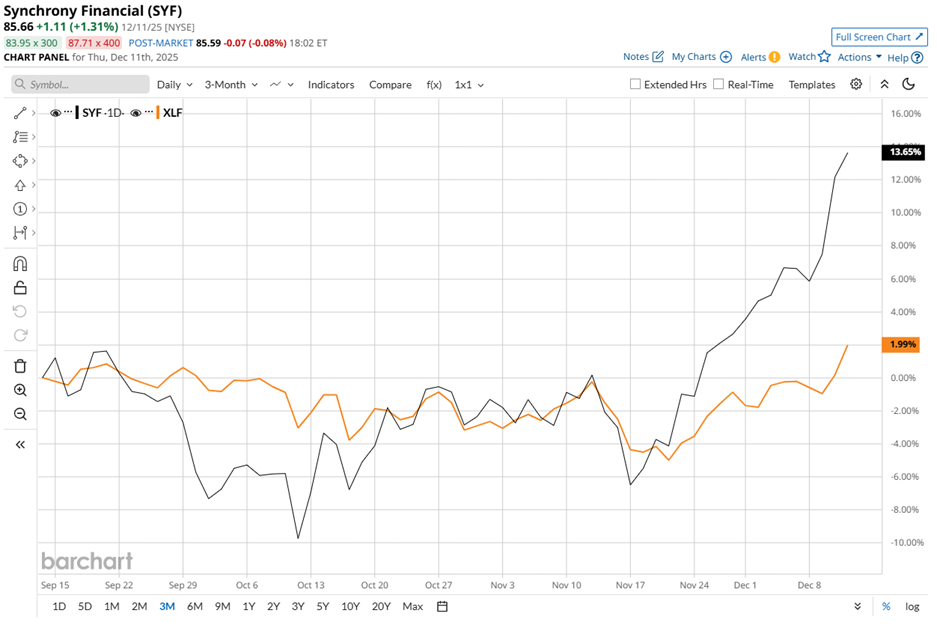
Longer-term performance sharpens the contrast. SYF stock has climbed 25% over the past 52 weeks and 31.8% year-to-date (YTD), whereas XLF gained 10.2% across 52 weeks and 13.5% YTD, signaling that shares of Synchrony continue to outperform.
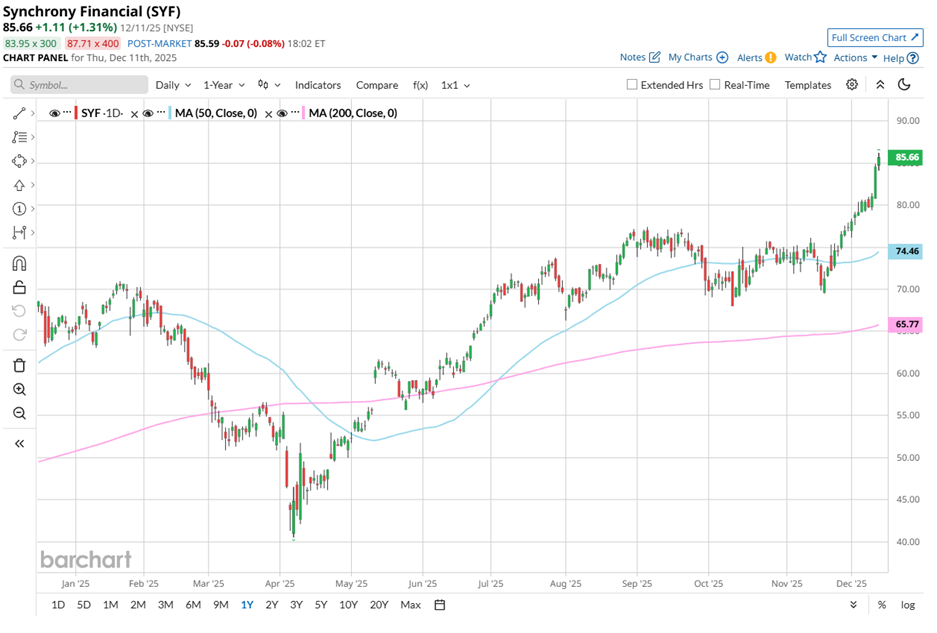
SYF stock has shown strong technical resilience, trading above its 50-day moving average of $74.46 and 200-day moving average of $65.77 since mid-June, although it did see a dip in October. However, its return above both averages by late Nov. signals renewed buyer confidence and strengthens trend support.
A notable intra-day jump occurred on Dec. 4, when SYF stock rose almost 1.6% after Synchrony and Mitsubishi Electric Trane HVAC US LLC (METUS) renewed their strategic residential-financing partnership. With already in effect since Oct 1, the multi-year renewal extends a decade-long collaboration and reinforces Synchrony’s position in a rapidly expanding, energy-efficient HVAC market.
For context, SYF’s rival SLM Corporation (SLM) has gained 3.4% over the past 52 weeks and declined marginally YTD, underscoring SYF’s stronger momentum and more convincing market traction.
24 analysts are backing SYF’s fundamental strength with a “Moderate Buy” consensus rating, while the stock is already trading above its mean price target of $82.58.
On the date of publication, Aanchal Sugandh did not have (either directly or indirectly) positions in any of the securities mentioned in this article. All information and data in this article is solely for informational purposes. For more information please view the Barchart Disclosure Policy here.
More news from Barchart
- Nasdaq Futures Slip as Broadcom Results Fail to Ease AI Fears, Fed Speak on Tap
- As Trump Takes a Stand Against Deere, How Should You Play the Blue-Chip Dividend Stock?
- Archer Aviation Is Bringing Its Flying Cars to Saudi Arabia. Is ACHR Stock a Buy Here?
- USA Rare Earth Just Revved up Its Commercial Timeline. Should You Buy USAR Stock Here?


