Saint Petersburg, Florida-based Jabil Inc. (JBL) is a global manufacturing services provider that designs, engineers, and produces electronic and mechanical solutions for leading companies across industries such as healthcare, automotive, industrial, cloud, and consumer electronics. With a market cap of $23.8 billion, the company offers digital prototyping, printed electronics, device integration, circuit designing, and volume board assembly services.
Companies worth $10 billion or more are generally described as “large-cap stocks,” and JBL perfectly fits that description, with its market cap exceeding this mark, underscoring its size, influence, and dominance within the electronic components industry. The company operates a highly diversified, end-to-end manufacturing model with a growing focus on higher-margin, specialized solutions and long-term customer partnerships.
JBL shares touched their 52-week high of $237.14 on Sept. 23 and are currently trading 6.2% below the peak. Over the past three months, JBL stock has gained 3.9%, underperforming the Technology Select Sector SPDR Fund’s (XLK) 6.1% gains during the same time frame.
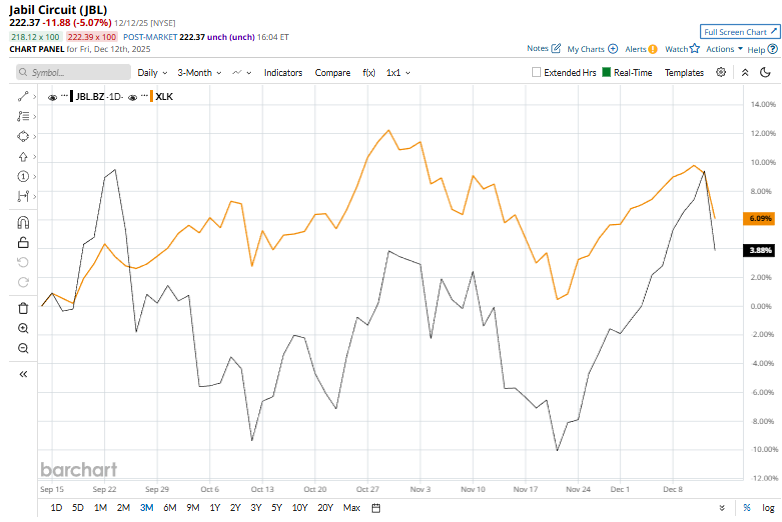
Over the longer term, Jabil’s stock has delivered standout performance, surging 54.5% year to date and rallying 66.4% over the past 52 weeks, eclipsing the Technology Select Sector SPDR Fund’s gains of 23.6% YTD and 20.7% over the past year.
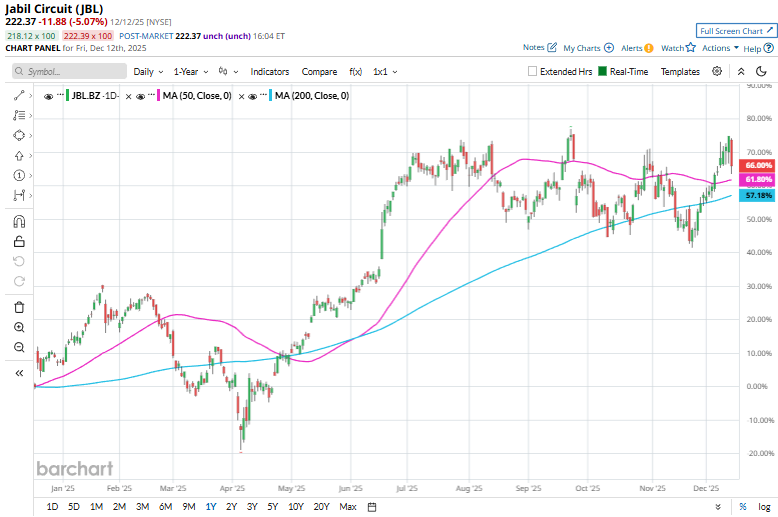
Despite recent bouts of volatility, JBL has regained technical momentum, holding firmly above its 50-day moving average since early December and its 200-day moving average since late November, signaling renewed investor confidence.
Jabil has outperformed the broader market over the past year due to its strong positioning in AI and data center infrastructure, which has driven robust demand in its Intelligent Infrastructure segment. That said, the stock briefly lost altitude on Dec. 12, slipping 5.2% as investors hit pause on AI-linked names amid growing unease that surging infrastructure spend may be getting ahead of near-term monetization, underscoring how quickly sentiment can swing even for market leaders.
JBL’s rival, Fabrinet (FN), has outpaced the stock with 114.2% gains on a YTD basis and a 91.6% rise over the past year.
Nevertheless, Wall Street analysts are bullish on JBL’s prospects. The stock has a consensus “Strong Buy” rating from the 10 analysts covering it, and the mean price target of $248.56 suggests a potential upside of 11.8% from current price levels.
On the date of publication, Kritika Sarmah did not have (either directly or indirectly) positions in any of the securities mentioned in this article. All information and data in this article is solely for informational purposes. For more information please view the Barchart Disclosure Policy here.
More news from Barchart


