ETFOptimize | High-performance ETF-based Investment Strategies

Quantitative strategies, Wall Street-caliber research, and insightful market analysis since 1998.


ETFOptimize | HOME
Close Window

How Is Kimco Realty's Stock Performance Compared to Other Real Estate Stocks?

With a market cap of $13.7 billion, Kimco Realty Corporation (KIM) is a leading U.S. real estate investment trust specializing in high-quality, open-air, grocery-anchored shopping centers and mixed-use properties concentrated in top metropolitan and high-barrier-to-entry markets. The company brings more than 65 years of expertise in shopping center ownership, management, acquisitions, and redevelopment. 

Companies valued at $10 billion or more are generally classified as “large-cap” stocks, and Kimco Realty fits this criterion perfectly. As of September 30, 2025, Kimco owned interests in 564 U.S. properties totaling approximately 100 million square feet, with a strong focus on necessity-based tenants and corporate responsibility.


Shares of the Jericho, New York-based company have declined 19.6% from its 52-week high of $25.06. Over the past three months, its shares have fallen nearly 10%, underperforming the Real Estate Select Sector SPDR Fund’s (XLRE) 3.8% dip during the same period.

www.barchart.com

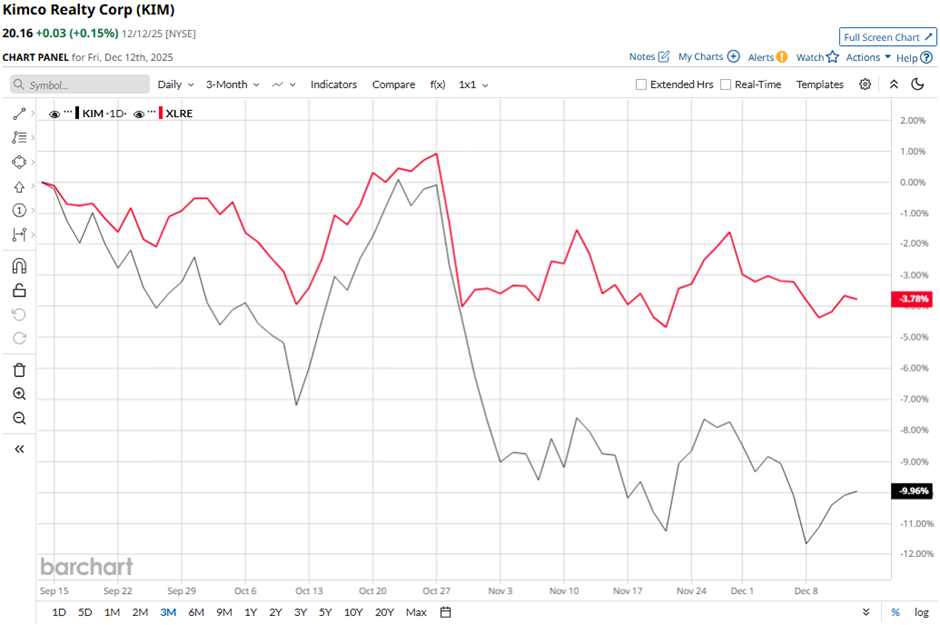
Longer term, KIM stock is down nearly 14% on a YTD basis, lagging behind XLRE's marginal gain. Moreover, shares of Kimco Realty have decreased 17.7% over the past 52 weeks, compared to XLRE's 5.3% decline over the same time frame.

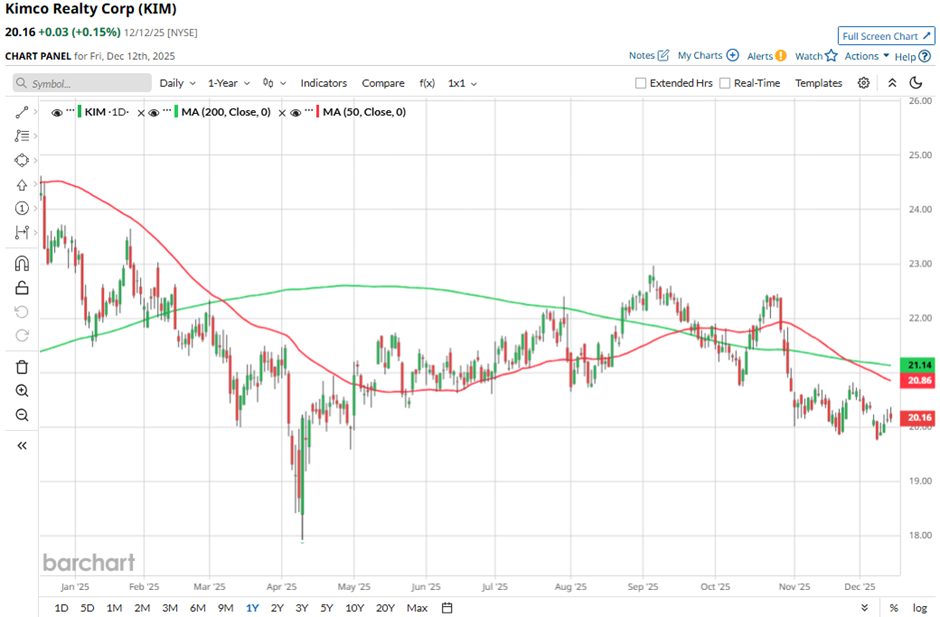
The stock has fallen below its 50-day and 200-day moving averages since late October.

www.barchart.com

Despite posting better-than-expected Q3 2025 FFO of $0.44 per share and revenue of $535.9 million, Kimco’s shares fell 1.9% on Oct. 30. The quarter reflected higher costs, including a $13.6 million increase in depreciation and amortization and an $8.0 million rise in interest expense, which partially offset revenue and operating gains.

In comparison, rival Realty Income Corporation (O) has outpaced KIM stock. Shares of Realty Income have risen 8.1% on a YTD basis and 4.7% over the past 52 weeks.

Despite the stock’s weak performance, analysts remain moderately optimistic about its prospects. KIM stock has a consensus rating of “Moderate Buy” from 25 analysts in coverage, and the mean price target of $24.20 is a premium of 20% to current levels.


On the date of publication, Sohini Mondal did not have (either directly or indirectly) positions in any of the securities mentioned in this article. All information and data in this article is solely for informational purposes. For more information please view the Barchart Disclosure Policy here.


More news from Barchart

Recent Quotes

View More
Symbol Price Change (%)
AMZN  221.27
+0.00 (0.00%)
AAPL  271.84
+0.00 (0.00%)
AMD  198.11
+0.00 (0.00%)
BAC  54.55
+0.00 (0.00%)
GOOG  298.06
+0.00 (0.00%)
META  649.50
+0.00 (0.00%)
MSFT  476.12
+0.00 (0.00%)
NVDA  170.94
+0.00 (0.00%)
ORCL  178.46
+0.00 (0.00%)
TSLA  467.26
+0.00 (0.00%)
Stock Quote API & Stock News API supplied by www.cloudquote.io
Quotes delayed at least 20 minutes.
By accessing this page, you agree to the Privacy Policy and Terms Of Service.


IntelligentValue Home
Close Window

DISCLAIMER

All content herein is issued solely for informational purposes and is not to be construed as an offer to sell or the solicitation of an offer to buy, nor should it be interpreted as a recommendation to buy, hold or sell (short or otherwise) any security.  All opinions, analyses, and information included herein are based on sources believed to be reliable, but no representation or warranty of any kind, expressed or implied, is made including but not limited to any representation or warranty concerning accuracy, completeness, correctness, timeliness or appropriateness. We undertake no obligation to update such opinions, analysis or information. You should independently verify all information contained on this website. Some information is based on analysis of past performance or hypothetical performance results, which have inherent limitations. We make no representation that any particular equity or strategy will or is likely to achieve profits or losses similar to those shown. Shareholders, employees, writers, contractors, and affiliates associated with ETFOptimize.com may have ownership positions in the securities that are mentioned. If you are not sure if ETFs, algorithmic investing, or a particular investment is right for you, you are urged to consult with a Registered Investment Advisor (RIA). Neither this website nor anyone associated with producing its content are Registered Investment Advisors, and no attempt is made herein to substitute for personalized, professional investment advice. Neither ETFOptimize.com, Global Alpha Investments, Inc., nor its employees, service providers, associates, or affiliates are responsible for any investment losses you may incur as a result of using the information provided herein. Remember that past investment returns may not be indicative of future returns.

Copyright © 1998-2017 ETFOptimize.com, a publication of Optimized Investments, Inc. All rights reserved.