ETFOptimize | High-performance ETF-based Investment Strategies

Quantitative strategies, Wall Street-caliber research, and insightful market analysis since 1998.


ETFOptimize | HOME
Close Window

How Is Revvity's Stock Performance Compared to Other Health Care Stocks?

Revvity, Inc. (RVTY), headquartered in Waltham, Massachusetts, is a leading provider of health sciences solutions, technologies, and diagnostic services. Valued at $11.4 billion by market cap, the company focuses on translational multi-omics technologies, biomarker identification, imaging, prediction, screening, detection, diagnosis, informatics, and other areas.

Companies worth $10 billion or more are generally described as “large-cap stocks,” and RVTY perfectly fits that description, with its market cap exceeding this mark, underscoring its size, influence, and dominance within the diagnostics & research industry. Revvity’s strengths include diversification, scale, cross-business synergies, brand equity, financial resilience, and technological capabilities. These strengths enable the company to innovate, adapt to market changes, and maintain a competitive edge in the healthcare and diagnostics landscape, driving growth and leadership in the industry.


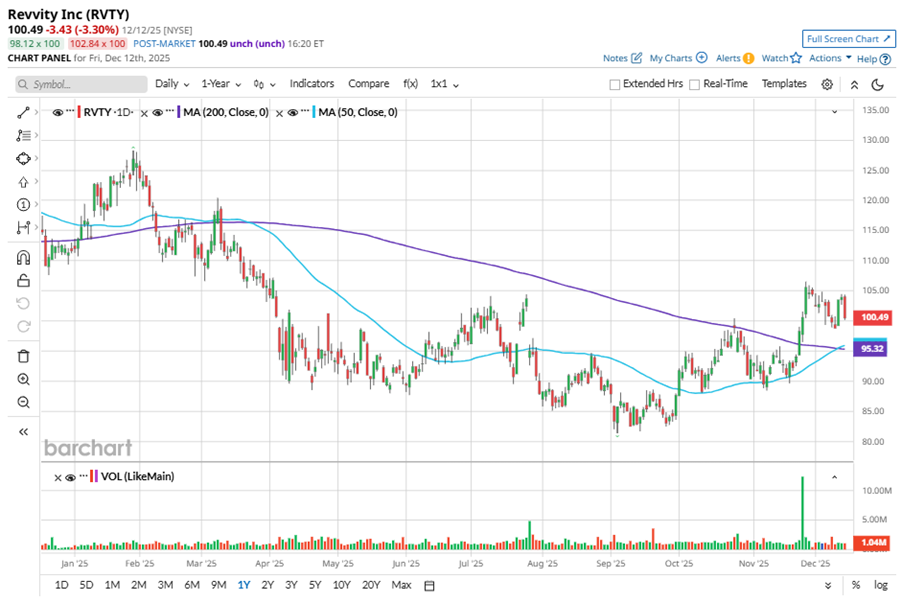
Despite its notable strength, RVTY slipped 21.7% from its 52-week high of $128.29, achieved on Jan. 30. Over the past three months, RVTY stock has gained 21.3%, outperforming the Health Care Select Sector SPDR Fund’s (XLV)11.6% gains during the same time frame.

www.barchart.com

In the longer term, shares of RVTY rose 5% on a six-month basis but dipped 13.4% over the past 52 weeks, underperforming XLV’s six-month gains of 12.6% and 9.3% returns over the last year.

To confirm the bullish trend, RVTY is trading above its 50-day moving average since early October, with slight fluctuations. The stock has been trading above its 200-day moving average since late November. 

www.barchart.com

On Oct. 27, RVTY shares closed down by 1.8% after reporting its Q3 results. Its revenue stood at $7 billion, up 2.2% year over year. The company’s adjusted EPS fell 7.8% from the year-ago quarter to $1.18. 

RVTY’s rival, Danaher Corporation (DHR), has taken the lead over the stock, with 10.4% gains on a six-month basis and a 3.5% downtick over the past 52 weeks.

Wall Street analysts are reasonably bullish on RVTY’s prospects. The stock has a consensus “Moderate Buy” rating from the 18 analysts covering it, and the mean price target of $112.53 suggests a potential upside of 12% from current price levels.


On the date of publication, Neha Panjwani did not have (either directly or indirectly) positions in any of the securities mentioned in this article. All information and data in this article is solely for informational purposes. For more information please view the Barchart Disclosure Policy here.


More news from Barchart

Recent Quotes

View More
Symbol Price Change (%)
AMZN  221.27
+0.00 (0.00%)
AAPL  271.84
+0.00 (0.00%)
AMD  198.11
+0.00 (0.00%)
BAC  54.55
+0.00 (0.00%)
GOOG  298.06
+0.00 (0.00%)
META  649.50
+0.00 (0.00%)
MSFT  476.12
+0.00 (0.00%)
NVDA  170.94
+0.00 (0.00%)
ORCL  178.46
+0.00 (0.00%)
TSLA  467.26
+0.00 (0.00%)
Stock Quote API & Stock News API supplied by www.cloudquote.io
Quotes delayed at least 20 minutes.
By accessing this page, you agree to the Privacy Policy and Terms Of Service.


IntelligentValue Home
Close Window

DISCLAIMER

All content herein is issued solely for informational purposes and is not to be construed as an offer to sell or the solicitation of an offer to buy, nor should it be interpreted as a recommendation to buy, hold or sell (short or otherwise) any security.  All opinions, analyses, and information included herein are based on sources believed to be reliable, but no representation or warranty of any kind, expressed or implied, is made including but not limited to any representation or warranty concerning accuracy, completeness, correctness, timeliness or appropriateness. We undertake no obligation to update such opinions, analysis or information. You should independently verify all information contained on this website. Some information is based on analysis of past performance or hypothetical performance results, which have inherent limitations. We make no representation that any particular equity or strategy will or is likely to achieve profits or losses similar to those shown. Shareholders, employees, writers, contractors, and affiliates associated with ETFOptimize.com may have ownership positions in the securities that are mentioned. If you are not sure if ETFs, algorithmic investing, or a particular investment is right for you, you are urged to consult with a Registered Investment Advisor (RIA). Neither this website nor anyone associated with producing its content are Registered Investment Advisors, and no attempt is made herein to substitute for personalized, professional investment advice. Neither ETFOptimize.com, Global Alpha Investments, Inc., nor its employees, service providers, associates, or affiliates are responsible for any investment losses you may incur as a result of using the information provided herein. Remember that past investment returns may not be indicative of future returns.

Copyright © 1998-2017 ETFOptimize.com, a publication of Optimized Investments, Inc. All rights reserved.