ETFOptimize | High-performance ETF-based Investment Strategies

Quantitative strategies, Wall Street-caliber research, and insightful market analysis since 1998.


ETFOptimize | HOME
Close Window

How Is Zebra Technologies’ Stock Performance Compared to Other Technology Stocks?

Zebra Technologies Corporation (ZBRA) is a technology company that specializes in enterprise asset intelligence and automatic identification and data capture solutions. The company designs, manufactures, and sells a broad portfolio of products and software, including barcode scanners, RFID readers, mobile computers, and specialty printers for labels, receipts, and cards. The company is headquartered in Lincolnshire, Illinois and has a market cap of around $13.6 billion.

Companies valued at $10 billion or more are generally classified as “large-cap” stocks, and Zebra Technologies fits right into that category. The company provides cutting-edge enterprise asset intelligence solutions that help organizations track and manage assets and workflows across industries such as retail, transportation, logistics, healthcare, and manufacturing. 


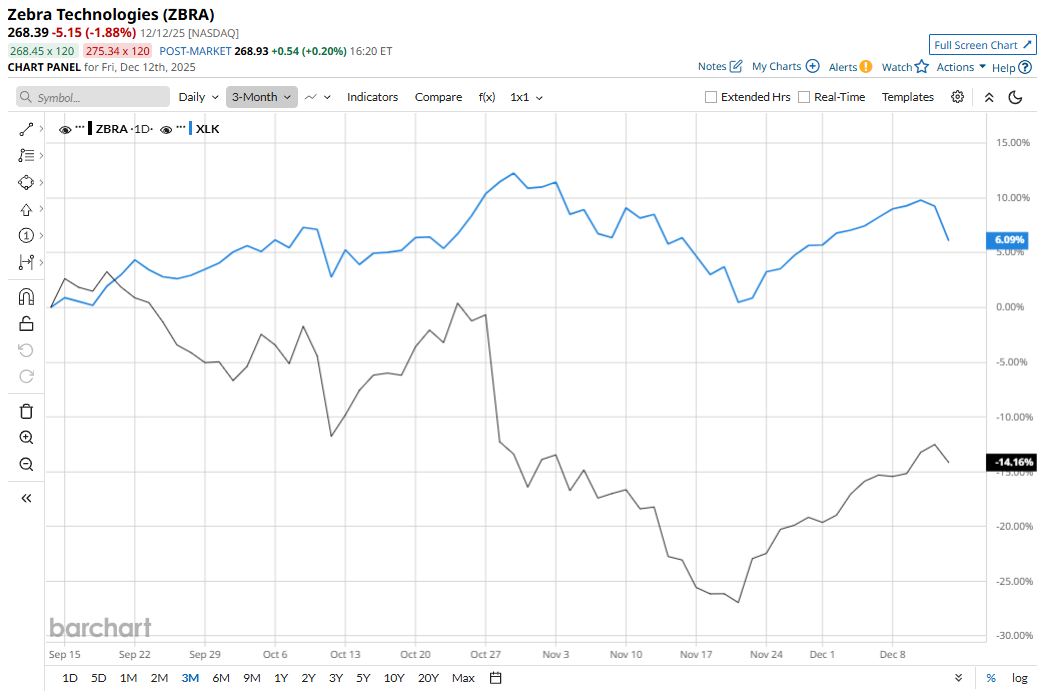
ZBRA is trading 37.3% below its 52-week high of $427.76, which it hit on Jan. 22. The stock has declined 14.2% over the past three months, underperforming the broader Technology Select Sector SPDR Fund’s (XLK) 6.1% return over the same time frame.

www.barchart.com

In the longer term, ZBRA is down 30.5% on a YTD basis and 34.2% over the past 52 weeks. In comparison, the XLK has gained 23.6% in 2025 and 20.7% over the past year.

The stock has been trading below the 200-day moving average since mid-August and below the 50-day moving average since early September, except for some fluctuations. 

www.barchart.com

In 2025, Zebra Technologies’ stock has declined even amid generally stable quarterly results because of macro-economic headwinds, including the impact of U.S. import tariffs, potential supply chain disruptions in a complex geopolitical landscape and broader market volatility that have dampened sentiment. 

Also, markets have reacted negatively to uneven geographic performance and uncertain growth in some regions. Notably, weakness in the European, Middle East, and Africa (EMEA) market, and a softer manufacturing environment, offset strong performance in North America and Asia-Pacific. 

ZBRA has underperformed its rival, Trimble Inc. (TRMB), which gained 13.6% on a YTD basis and 7.2% over the past year.

However, the stock has a consensus rating of “Moderate Buy” from 17 analysts in coverage. The mean price target of $360.50 indicates a potential 34.3% upside ahead. 


On the date of publication, Subhasree Kar did not have (either directly or indirectly) positions in any of the securities mentioned in this article. All information and data in this article is solely for informational purposes. For more information please view the Barchart Disclosure Policy here.


More news from Barchart

Recent Quotes

View More
Symbol Price Change (%)
AMZN  221.27
+0.00 (0.00%)
AAPL  271.84
+0.00 (0.00%)
AMD  198.11
+0.00 (0.00%)
BAC  54.55
+0.00 (0.00%)
GOOG  298.06
+0.00 (0.00%)
META  649.50
+0.00 (0.00%)
MSFT  476.12
+0.00 (0.00%)
NVDA  170.94
+0.00 (0.00%)
ORCL  178.46
+0.00 (0.00%)
TSLA  467.26
+0.00 (0.00%)
Stock Quote API & Stock News API supplied by www.cloudquote.io
Quotes delayed at least 20 minutes.
By accessing this page, you agree to the Privacy Policy and Terms Of Service.


IntelligentValue Home
Close Window

DISCLAIMER

All content herein is issued solely for informational purposes and is not to be construed as an offer to sell or the solicitation of an offer to buy, nor should it be interpreted as a recommendation to buy, hold or sell (short or otherwise) any security.  All opinions, analyses, and information included herein are based on sources believed to be reliable, but no representation or warranty of any kind, expressed or implied, is made including but not limited to any representation or warranty concerning accuracy, completeness, correctness, timeliness or appropriateness. We undertake no obligation to update such opinions, analysis or information. You should independently verify all information contained on this website. Some information is based on analysis of past performance or hypothetical performance results, which have inherent limitations. We make no representation that any particular equity or strategy will or is likely to achieve profits or losses similar to those shown. Shareholders, employees, writers, contractors, and affiliates associated with ETFOptimize.com may have ownership positions in the securities that are mentioned. If you are not sure if ETFs, algorithmic investing, or a particular investment is right for you, you are urged to consult with a Registered Investment Advisor (RIA). Neither this website nor anyone associated with producing its content are Registered Investment Advisors, and no attempt is made herein to substitute for personalized, professional investment advice. Neither ETFOptimize.com, Global Alpha Investments, Inc., nor its employees, service providers, associates, or affiliates are responsible for any investment losses you may incur as a result of using the information provided herein. Remember that past investment returns may not be indicative of future returns.

Copyright © 1998-2017 ETFOptimize.com, a publication of Optimized Investments, Inc. All rights reserved.