Quest Diagnostics Incorporated (DGX), headquartered in Secaucus, New Jersey, is a leader in diagnostic information services. The company operates numerous patient service centers and laboratories worldwide, providing routine, esoteric, and advanced testing for conditions including cancer, infectious diseases, and cardiovascular diseases.
It supports physicians, hospitals, and employers through molecular diagnostics, anatomic pathology, and health IT solutions. With operations in diagnostic information services and solutions, Quest Diagnostics improves health outcomes through precise insights. The company has a market capitalization of $20.31 billion, which classifies it as a “large-cap” stock.
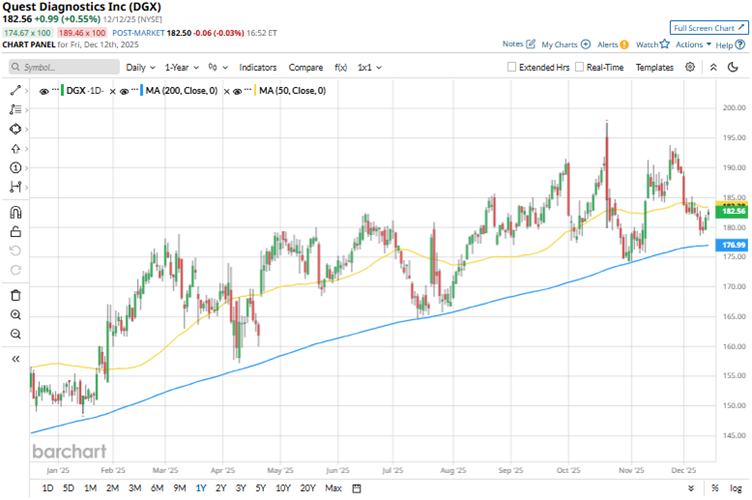
Quest Diagnostics’ shares reached a 52-week high of $197.55 in October, but are down 7.6% from that level. DGX’s stock is down marginally over the past three months, possibly due to short-term downward pressure amid broader market fluctuations. On the other hand, the State Street Health Care Select Sector SPDR ETF (XLV) has gained 11.6% over the same period, outperforming the stock.

Over the longer term, this stark underperformance somewhat fades. Over the past six months, the stock has gained approximately 2%, while the ETF has risen 12.6%. However, over the past 52 weeks, DGX’s stock has increased by 17%, outperforming the Health Care ETF’s 9.3% return. The stock has been consistently trading above its 200-day moving average over the past year and is currently hovering near its 50-day moving average.
On Oct. 21, DGX reported its third-quarter results for 2025. The company’s net revenues increased 13.1% year-over-year (YOY) to $2.82 billion, exceeding Wall Street analysts’ estimate of $2.72 billion. Its topline growth, including 6.8% organic growth, was driven by the widespread adoption of its clinical breakthroughs, expansion of its consumer channels, and contributions from acquisitions. DGX’s adjusted EPS also increased by 13% YOY to $2.60, which was higher than the $2.51 that Wall Street analysts had expected.
Based on strong results, the company also increased its fiscal 2025 net revenue guidance from a range of $10.80 billion-$10.92 billion to $10.96 billion-$11 billion, and adjusted EPS guidance range from $9.63-$9.83 to $9.76-$9.84. Despite this, the stock dropped 3% intraday on Oct. 21.
We compare DGX’s performance with that of another medical diagnostics and research firm, Exact Sciences Corporation (EXAS), which has gained 62.4% over the past 52 weeks and 87.9% over the past six months. Therefore, Quest Diagnostics has been the clear underperformer over these periods.
Wall Street analysts are moderately bullish on DGX’s stock. The stock has a consensus rating of “Moderate Buy” from the 18 analysts covering it. The mean price target of $198.76 indicates an 8.9% upside compared to current levels. The Street-high price target of $215 indicates a 17.8% upside.
On the date of publication, Anushka Dutta did not have (either directly or indirectly) positions in any of the securities mentioned in this article. All information and data in this article is solely for informational purposes. For more information please view the Barchart Disclosure Policy here.
More news from Barchart


