The stock market, especially Nasdaq-100 Index ($IUXX) names, has been partners with the AI trade for more than 3 years. But recently, the 10-year US Treasury yield is starting to butt in, putting that long rally at risk. And the way the stock market goes, it could get angry quickly. That’s the nature of a high-strung, one-way trade.
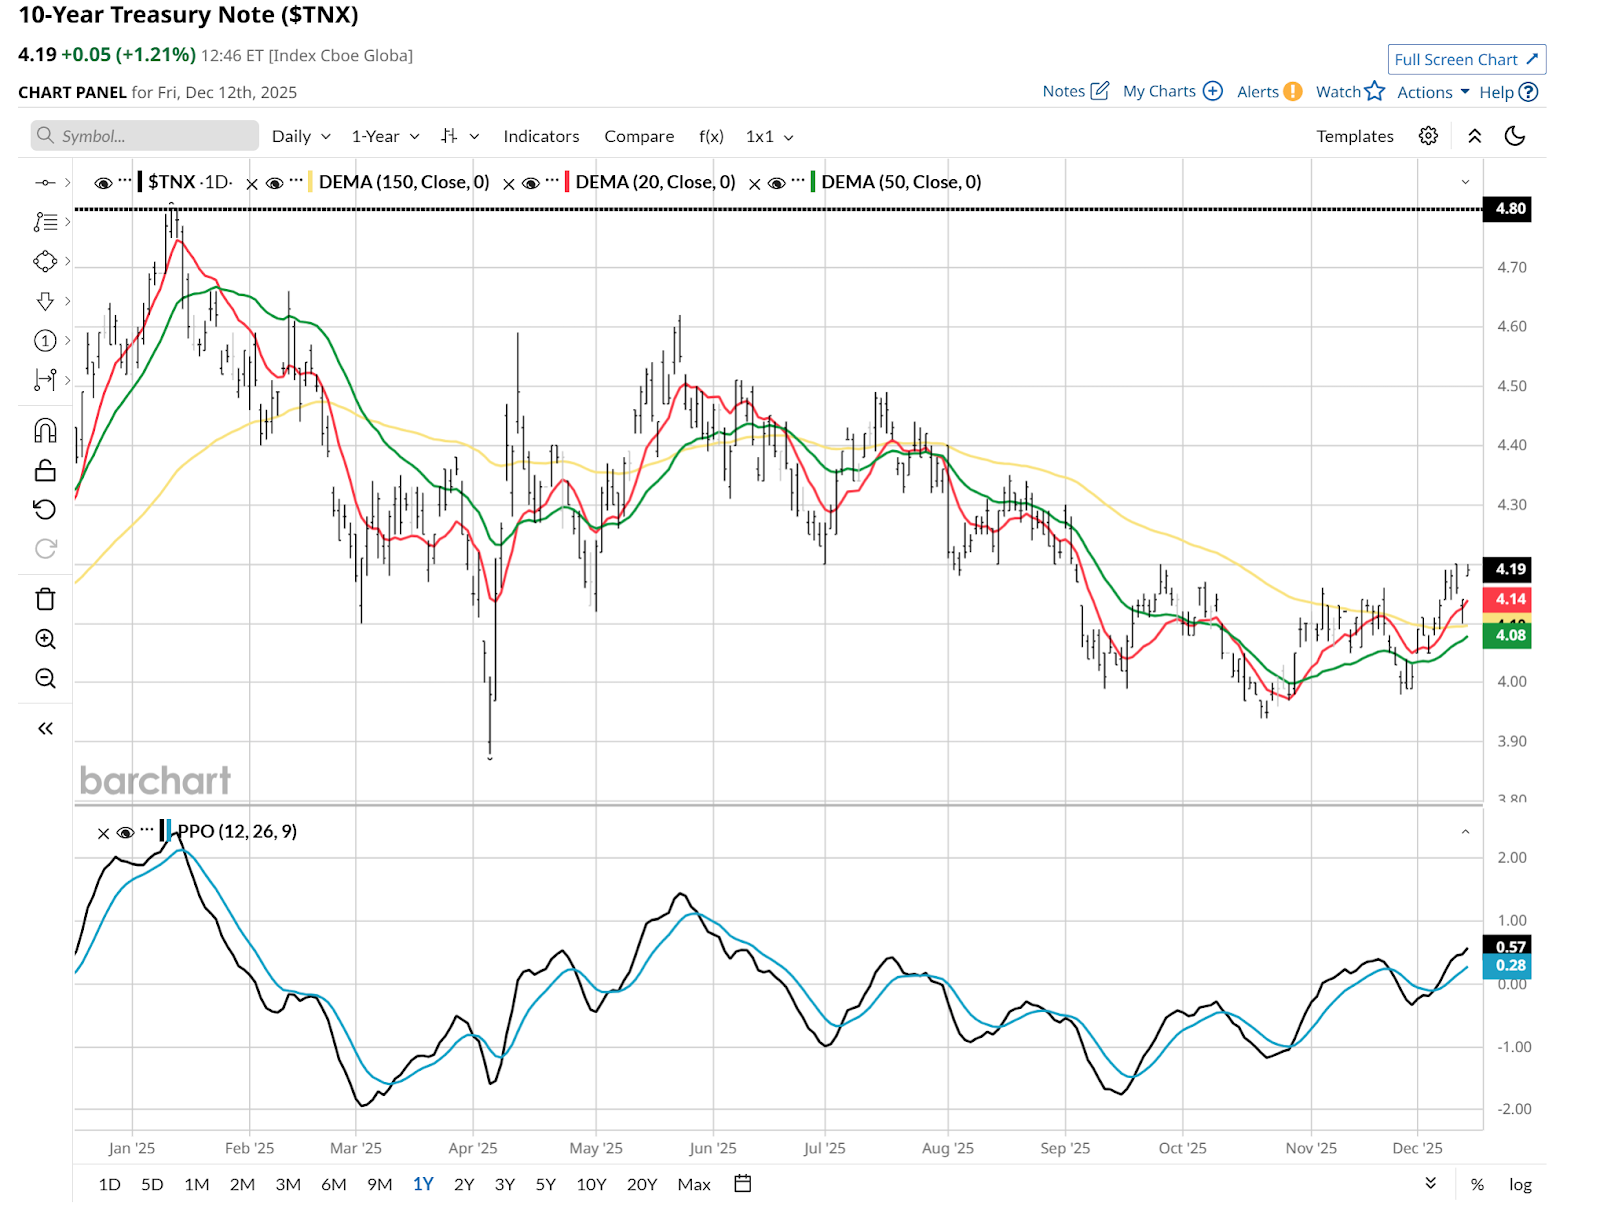
Here’s a snapshot of that potential party-pooper. The one who’s moving in on the market’s darling, the Nasdaq-100. It’s the 10-year U.S. Treasury Bond yield, and it is starting to emerge from a multi-month trading range. If that yield continues much higher, it could have 4.8% in its sights.
And that would be a panic-inducing situation along the way. I just don’t think the stock market will deal well with rates that high. Not consumers, corporations, and the government, which all need rates to be lower than they are in order to keep the party going.
Why Investors Need to Pay Attention to Bonds Now
Here’s the problem for the stock market. Take a look at the Invesco Nasdaq QQQ ETF (QQQ), now a $400 billion ETF. We can’t get too pumped up about it from just a short time frame, except that since 2008, most market declines have been the so-called “rip your face off” types. The opposite of some technology stock rallies.
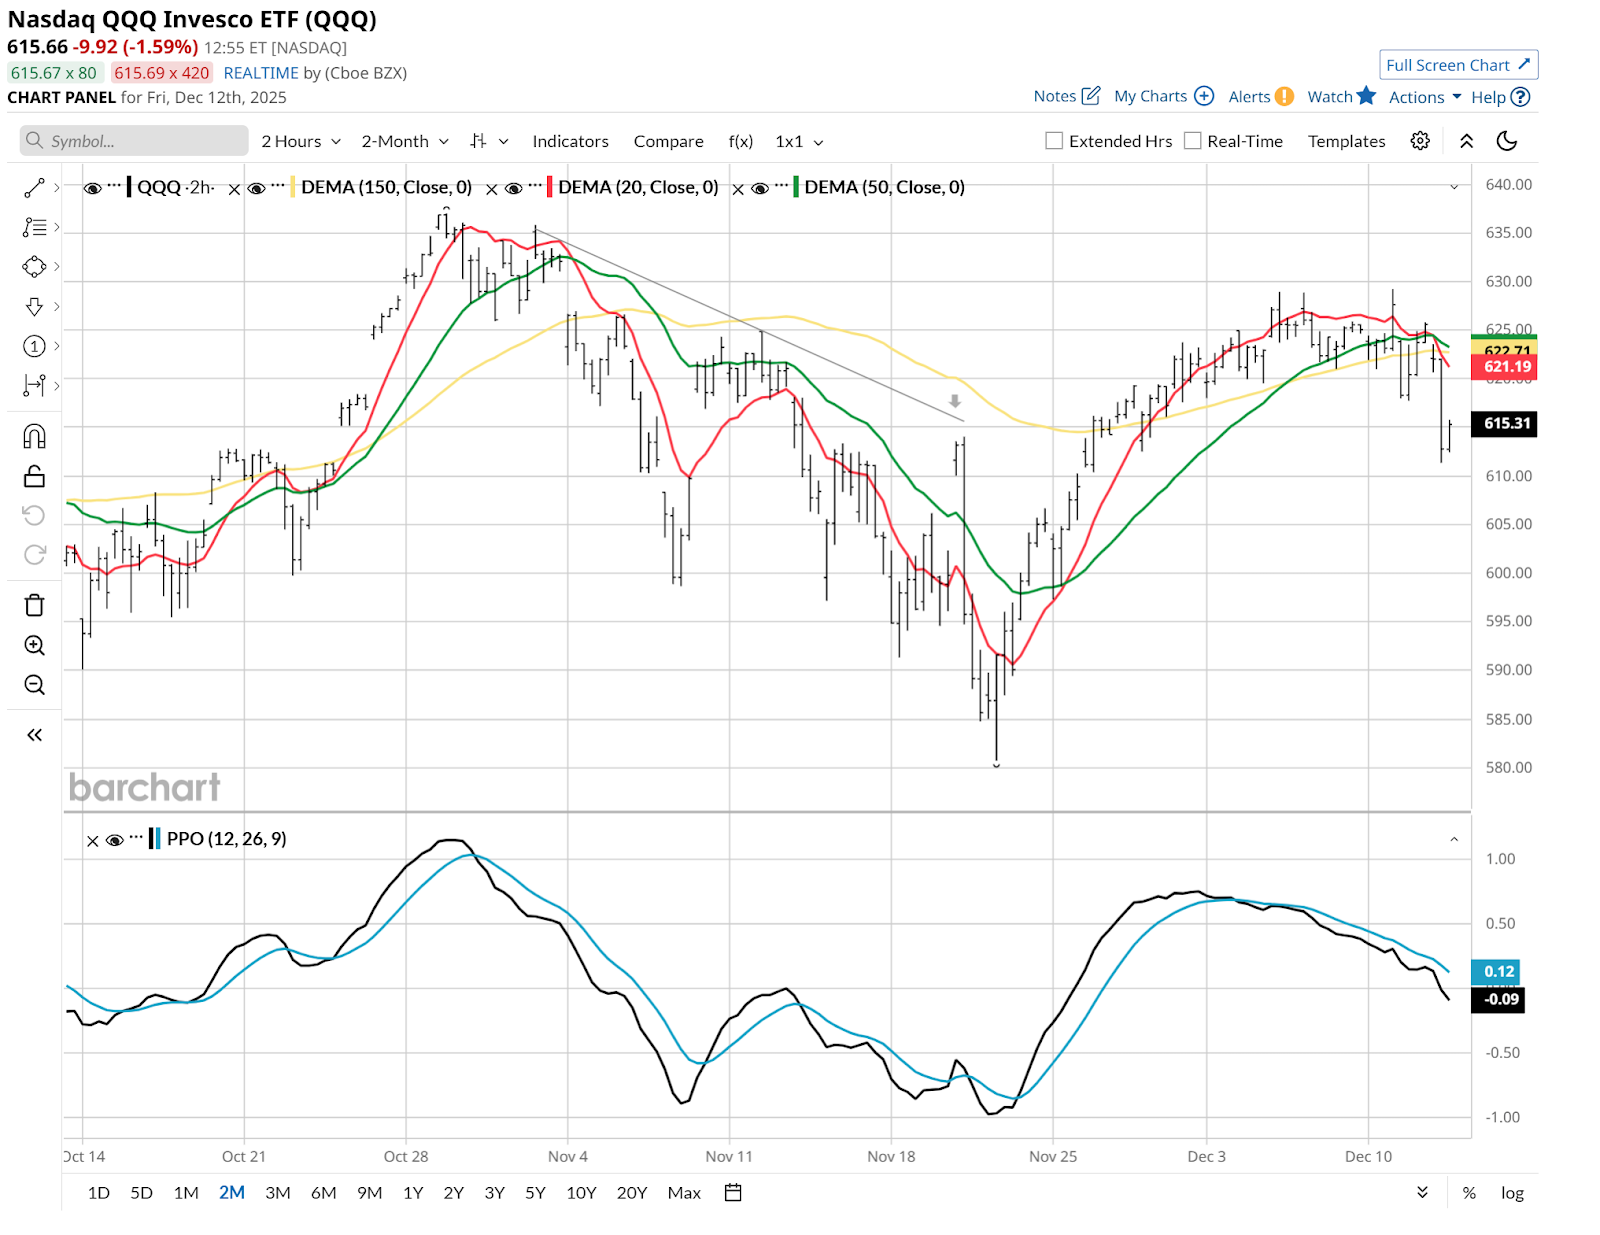
That’s where the charts have always been my favorite guide. I’ll start with a 2-hour view, a trader’s time frame.
This is a very short-term trend, but if that pattern extends to longer time frames such as daily and weekly, that’s where the sustained declines occur. Most of the time, the market hints at doing that, then abruptly turns around. That’s the “buy the dip” force, prompted in large part by index fund buying.
So this 2-hour time frame has a wilting Price Percentage Oscillator (PPO) indicator, and the 20- and 50-period moving averages are starting to turn down as well. That’s notable.
The daily view is shown below, and it is just not there yet. This makes the current week a key one for QQQ, and by extension, the broad stocker market.
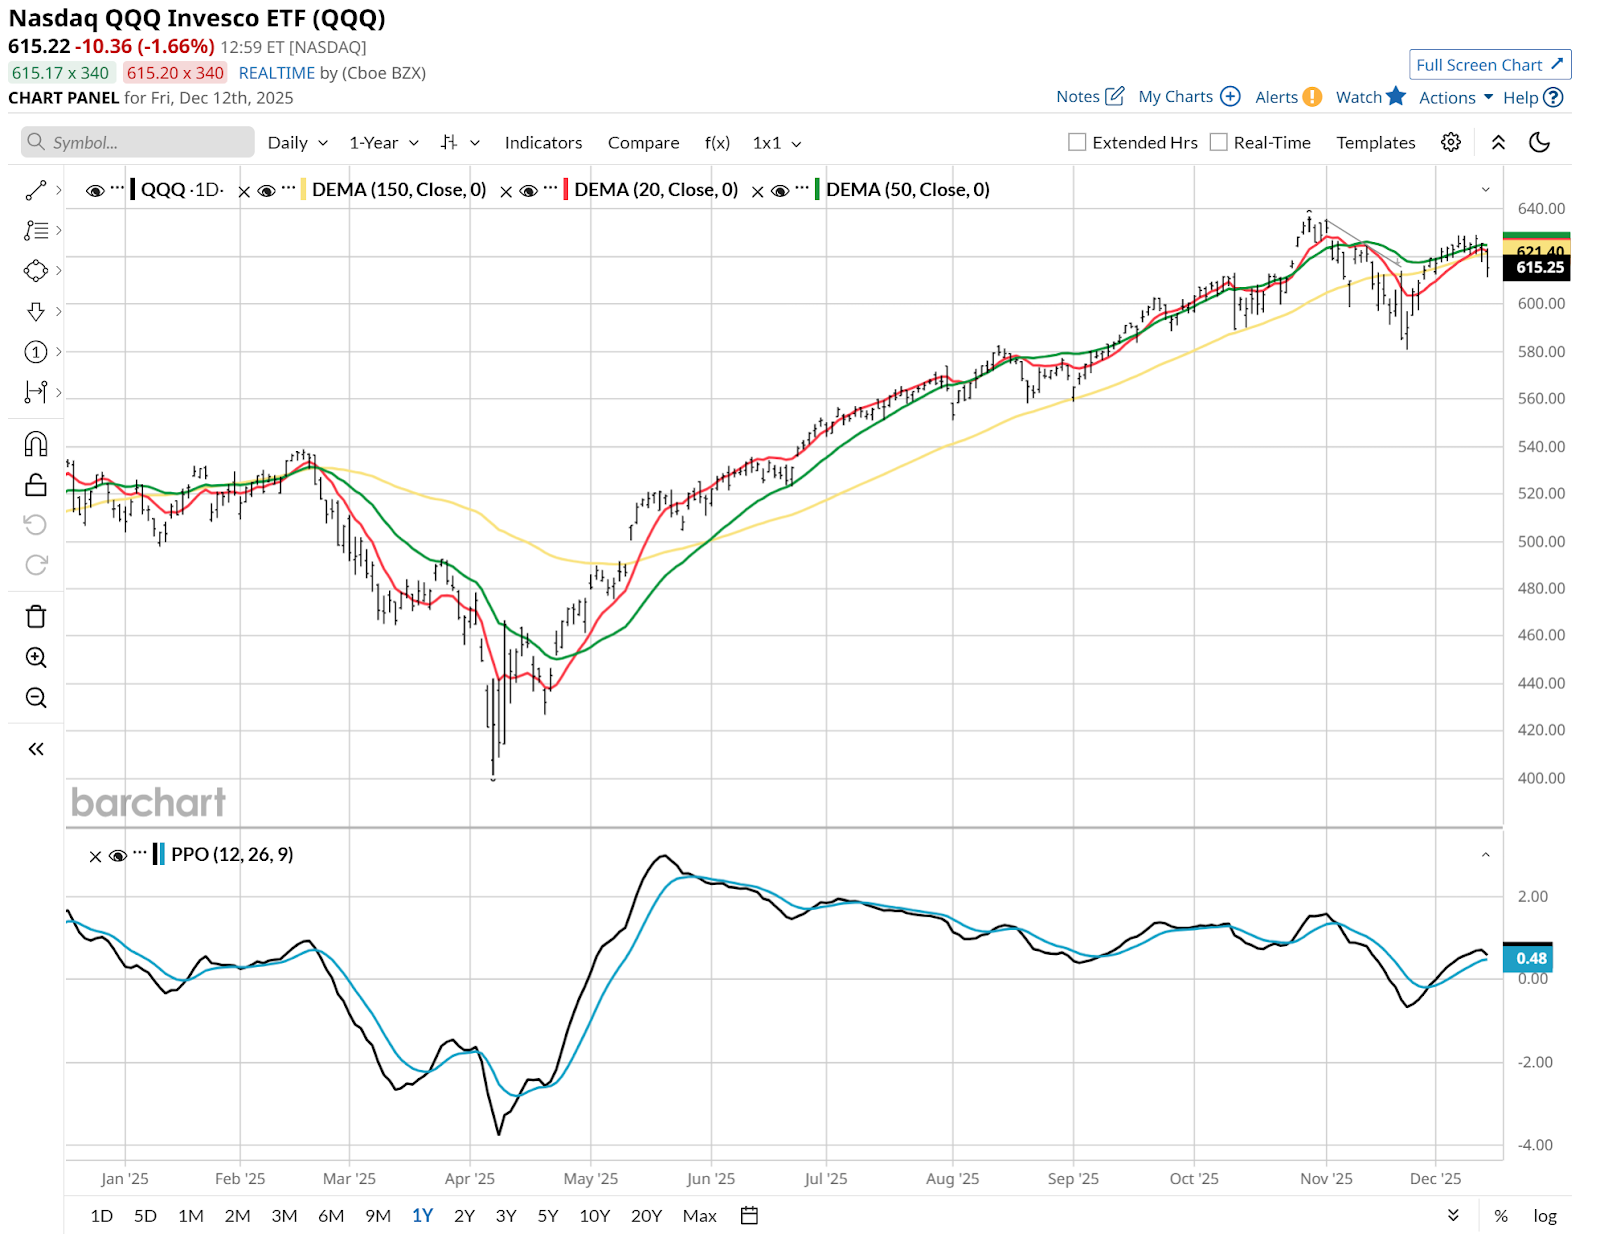
Nothing would ruin the holiday season like a market plunge to end the year. And while these charts are still in their infancy in terms of the moves (down in QQQ, up in the 10-year rate), every down market starts with a trickle, then builds up to something more significant. Investors and traders blow it off at first. Then, the real damage happens.
I don’t predict the future, I manage risk of major loss. And at least for now, that risk is picking up, at least enough to notice.
Rob Isbitts, founder of Sungarden Investment Publishing, is a semi-retired chief investment officer, whose current research is found here at Barchart, and at his ETF Yourself subscription service on Substack. To copy-trade Rob’s portfolios, check out the new Pi Trade app.
On the date of publication, Rob Isbitts did not have (either directly or indirectly) positions in any of the securities mentioned in this article. All information and data in this article is solely for informational purposes. For more information please view the Barchart Disclosure Policy here.
More news from Barchart
- The QQQ Is at Risk of a Christmas Crash, So Pay Attention to Bond Yields Right Now
- Did the QQQ Bull Run Just End? Here’s Why This Candlestick is a Bearish Confirmation.
- Small Caps Strike Back: See Why the Russell 2000 Futures Are Heating Up for 2026
- After a Record-Setting Run, This Signal Says Silver Prices Might Be Peaking. Here’s How to Play It.


