ETFOptimize | High-performance ETF-based Investment Strategies

Quantitative strategies, Wall Street-caliber research, and insightful market analysis since 1998.


ETFOptimize | HOME
Close Window

Bio-Techne Stock: Is TECH Underperforming the Healthcare Sector?

With a market cap of $9.1 billion, Bio-Techne Corporation (TECH) is a global life sciences company that develops, manufactures, and sells reagents, instruments, and services for research, diagnostics, and bioprocessing markets. The company operates through two segments: Protein Sciences and Diagnostics and Spatial Biology.

Companies valued less than $10 billion are generally classified as “mid-cap” stocks, and Bio-Techne fits this criterion perfectly. The company’s offerings support applications ranging from protein analysis and molecular diagnostics to oncology and genetic research.


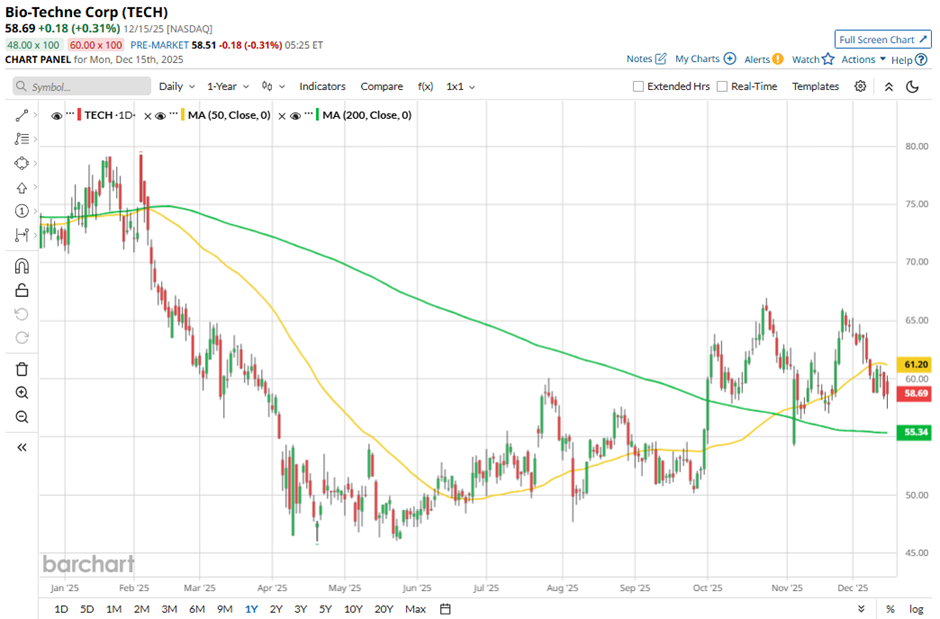
Shares of the Minneapolis, Minnesota-based company have decreased nearly 26% from its 52-week high of $79.28. TECH stock has increased 13.7% over the past three months, slightly lagging behind the Health Care Select Sector SPDR Fund’s (XLV) 14% gain over the same time frame.

www.barchart.com

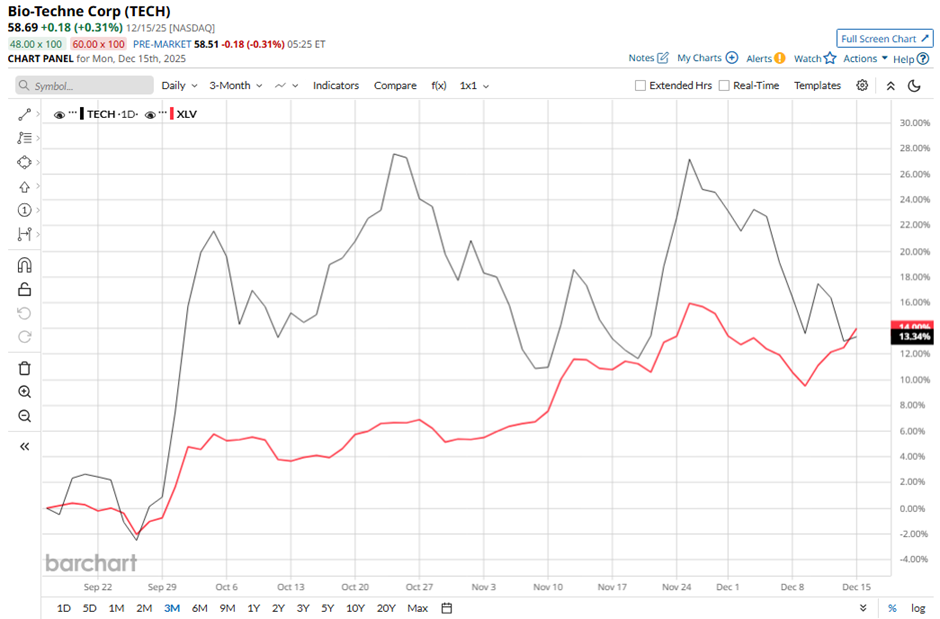
Longer term, TECH stock is down 18.5% on a YTD basis, underperforming XLV’s 13.5% rise. Moreover, shares of the company have declined 22.5% over the past 52 weeks, compared to XLV’s 10.7% return over the same time frame.

Yet, the stock has been trading above its 200-day moving average since October. 

www.barchart.com

Shares of Bio-Techne fell 1.9% on Nov. 5 after the company reported a 1% year-over-year revenue decline in Q1 2026 to $286.6 million, driven by a 3% organic decline in Protein Sciences and a 4% decline in Diagnostics and Spatial Biology. The decline reflected cell therapy timing headwinds that reduced growth by 200 basis points in Q1 and are expected to worsen to 400 basis points in Q2, along with continued biotech funding softness. Investor sentiment was further pressured by management maintaining low single-digit 2026 growth guidance.

In comparison, rival Quest Diagnostics Incorporated (DGX) has outpaced TECH stock. DGX stock has returned 22% on a YTD basis and 18.8% over the past 52 weeks.

Despite the stock’s underperformance, analysts remain bullish about its prospects. TECH stock has a consensus rating of “Strong Buy” from 15 analysts in coverage, and the mean price target of $68.58 is a premium of 16.9% to current levels.


On the date of publication, Sohini Mondal did not have (either directly or indirectly) positions in any of the securities mentioned in this article. All information and data in this article is solely for informational purposes. For more information please view the Barchart Disclosure Policy here.


More news from Barchart

Recent Quotes

View More
Symbol Price Change (%)
AMZN  221.27
+0.00 (0.00%)
AAPL  271.84
+0.00 (0.00%)
AMD  198.11
+0.00 (0.00%)
BAC  54.55
+0.00 (0.00%)
GOOG  298.06
+0.00 (0.00%)
META  649.50
+0.00 (0.00%)
MSFT  476.12
+0.00 (0.00%)
NVDA  170.94
+0.00 (0.00%)
ORCL  178.46
+0.00 (0.00%)
TSLA  467.26
+0.00 (0.00%)
Stock Quote API & Stock News API supplied by www.cloudquote.io
Quotes delayed at least 20 minutes.
By accessing this page, you agree to the Privacy Policy and Terms Of Service.


IntelligentValue Home
Close Window

DISCLAIMER

All content herein is issued solely for informational purposes and is not to be construed as an offer to sell or the solicitation of an offer to buy, nor should it be interpreted as a recommendation to buy, hold or sell (short or otherwise) any security.  All opinions, analyses, and information included herein are based on sources believed to be reliable, but no representation or warranty of any kind, expressed or implied, is made including but not limited to any representation or warranty concerning accuracy, completeness, correctness, timeliness or appropriateness. We undertake no obligation to update such opinions, analysis or information. You should independently verify all information contained on this website. Some information is based on analysis of past performance or hypothetical performance results, which have inherent limitations. We make no representation that any particular equity or strategy will or is likely to achieve profits or losses similar to those shown. Shareholders, employees, writers, contractors, and affiliates associated with ETFOptimize.com may have ownership positions in the securities that are mentioned. If you are not sure if ETFs, algorithmic investing, or a particular investment is right for you, you are urged to consult with a Registered Investment Advisor (RIA). Neither this website nor anyone associated with producing its content are Registered Investment Advisors, and no attempt is made herein to substitute for personalized, professional investment advice. Neither ETFOptimize.com, Global Alpha Investments, Inc., nor its employees, service providers, associates, or affiliates are responsible for any investment losses you may incur as a result of using the information provided herein. Remember that past investment returns may not be indicative of future returns.

Copyright © 1998-2017 ETFOptimize.com, a publication of Optimized Investments, Inc. All rights reserved.