ETFOptimize | High-performance ETF-based Investment Strategies

Quantitative strategies, Wall Street-caliber research, and insightful market analysis since 1998.


ETFOptimize | HOME
Close Window

How Is Wynn Resorts’ Stock Performance Compared to Other Consumer Discretionary Stocks?

Valued at a market cap of $12.9 billion, Wynn Resorts, Limited (WYNN) is a global luxury hospitality and gaming company that develops and operates high-end integrated resorts featuring casinos, hotels, fine dining, retail, and entertainment. The Las Vegas, Nevada-based company’s portfolio includes flagship properties in Las Vegas and Macau, with additional exposure through its Boston-area resort.

Companies worth $10 billion or more are typically classified as “large-cap stocks,” and WYNN fits the label perfectly, with its market cap exceeding this threshold, underscoring its size, influence, and dominance within the resorts & casinos industry. Wynn is known for its premium brand positioning, strong focus on service quality, and significant leverage to high-end tourism and gaming demand, particularly in the Macau market.


This luxury resort operator is currently trading 6.3% below its 52-week high of $134.72, reached on Dec. 1. Shares of WYNN have rallied 2.8% over the past three months, outperforming the Consumer Discretionary Select Sector SPDR Fund’s (XLY1.2% return during the same time frame.

www.barchart.com

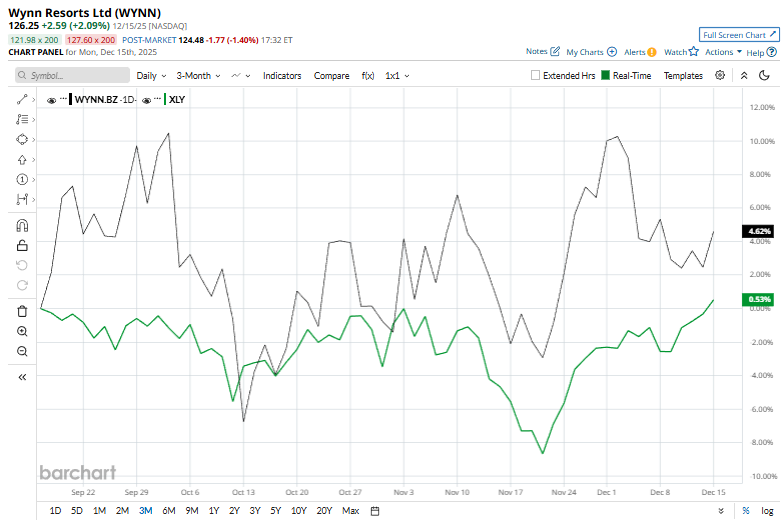
In the longer term, WYNN has surged 33.6% over the past 52 weeks, notably outpacing XLY's 3.4% uptick over the same time period. Moreover, on a YTD basis, shares of WYNN are up 46.5%, compared to XLY’s 8.5% rise.

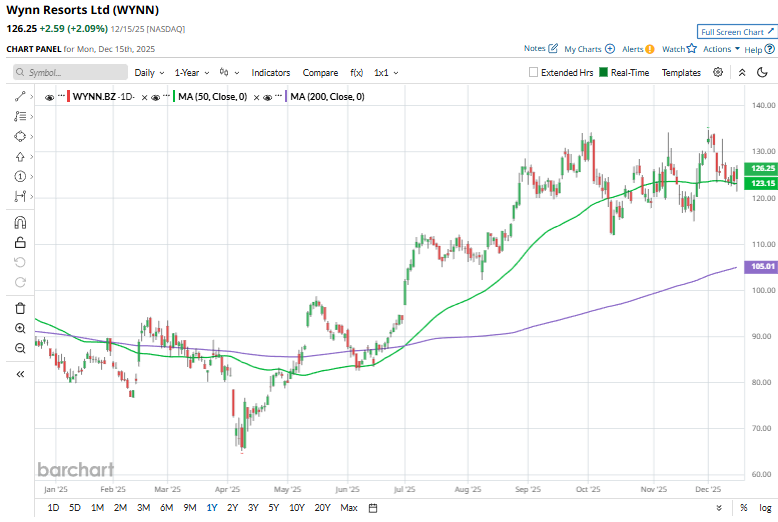
To confirm its bullish trend, WYNN has been trading above its 200-day and 50-day moving averages since early May, despite recent fluctuations.

www.barchart.com

Shares of Wynn Resorts rose 3.7% on Dec. 1 after The Goldman Sachs Group, Inc. (GS) added the stock to its “Conviction Buy” list, citing strength in the company’s Las Vegas operations and improving conditions in Macau. Goldman reiterated its “Buy” rating and set a $145 price target, supported by data showing Macau gaming revenue rose 14.4% year over year in November, marking the tenth consecutive month of growth. The upbeat outlook helped push Wynn shares toward multi-year highs during the session.

WYNN has also outperformed its rival, Las Vegas Sands Corp. (LVS), which gained 24.4% over the past 52 weeks and 30.4% on a YTD basis.

Given WYNN’s recent outperformance, analysts remain highly optimistic about its prospects. The stock has a consensus rating of "Strong Buy” from the 17 analysts covering it, and the mean price target of $144.94 suggests a 14.8% premium to its current price levels. 


On the date of publication, Kritika Sarmah did not have (either directly or indirectly) positions in any of the securities mentioned in this article. All information and data in this article is solely for informational purposes. For more information please view the Barchart Disclosure Policy here.


More news from Barchart

Recent Quotes

View More
Symbol Price Change (%)
AMZN  221.27
-1.29 (-0.58%)
AAPL  271.84
-2.77 (-1.01%)
AMD  198.11
-11.06 (-5.29%)
BAC  54.55
-0.26 (-0.47%)
GOOG  298.05
-9.68 (-3.15%)
META  649.50
-7.65 (-1.16%)
MSFT  476.12
-0.27 (-0.06%)
NVDA  170.94
-6.78 (-3.81%)
ORCL  178.46
-10.19 (-5.40%)
TSLA  467.26
-22.62 (-4.62%)
Stock Quote API & Stock News API supplied by www.cloudquote.io
Quotes delayed at least 20 minutes.
By accessing this page, you agree to the Privacy Policy and Terms Of Service.


IntelligentValue Home
Close Window

DISCLAIMER

All content herein is issued solely for informational purposes and is not to be construed as an offer to sell or the solicitation of an offer to buy, nor should it be interpreted as a recommendation to buy, hold or sell (short or otherwise) any security.  All opinions, analyses, and information included herein are based on sources believed to be reliable, but no representation or warranty of any kind, expressed or implied, is made including but not limited to any representation or warranty concerning accuracy, completeness, correctness, timeliness or appropriateness. We undertake no obligation to update such opinions, analysis or information. You should independently verify all information contained on this website. Some information is based on analysis of past performance or hypothetical performance results, which have inherent limitations. We make no representation that any particular equity or strategy will or is likely to achieve profits or losses similar to those shown. Shareholders, employees, writers, contractors, and affiliates associated with ETFOptimize.com may have ownership positions in the securities that are mentioned. If you are not sure if ETFs, algorithmic investing, or a particular investment is right for you, you are urged to consult with a Registered Investment Advisor (RIA). Neither this website nor anyone associated with producing its content are Registered Investment Advisors, and no attempt is made herein to substitute for personalized, professional investment advice. Neither ETFOptimize.com, Global Alpha Investments, Inc., nor its employees, service providers, associates, or affiliates are responsible for any investment losses you may incur as a result of using the information provided herein. Remember that past investment returns may not be indicative of future returns.

Copyright © 1998-2017 ETFOptimize.com, a publication of Optimized Investments, Inc. All rights reserved.