ETFOptimize | High-performance ETF-based Investment Strategies

Quantitative strategies, Wall Street-caliber research, and insightful market analysis since 1998.


ETFOptimize | HOME
Close Window

Is EMCOR Group Stock Outperforming the S&P 500?

Norwalk, Connecticut-based EMCOR Group, Inc. (EME) operates as one of the leading providers of mechanical and electrical construction, industrial and energy infrastructure, as well as building services for a diverse range of businesses. With a market cap of $27.9 billion, the company serves commercial, industrial, utility, and institutional clients.

Companies worth $10 billion or more are generally described as "large-cap stocks." EMCOR fits right into that category, with its market cap exceeding this threshold, reflecting its substantial size and influence in the engineering & construction industry.


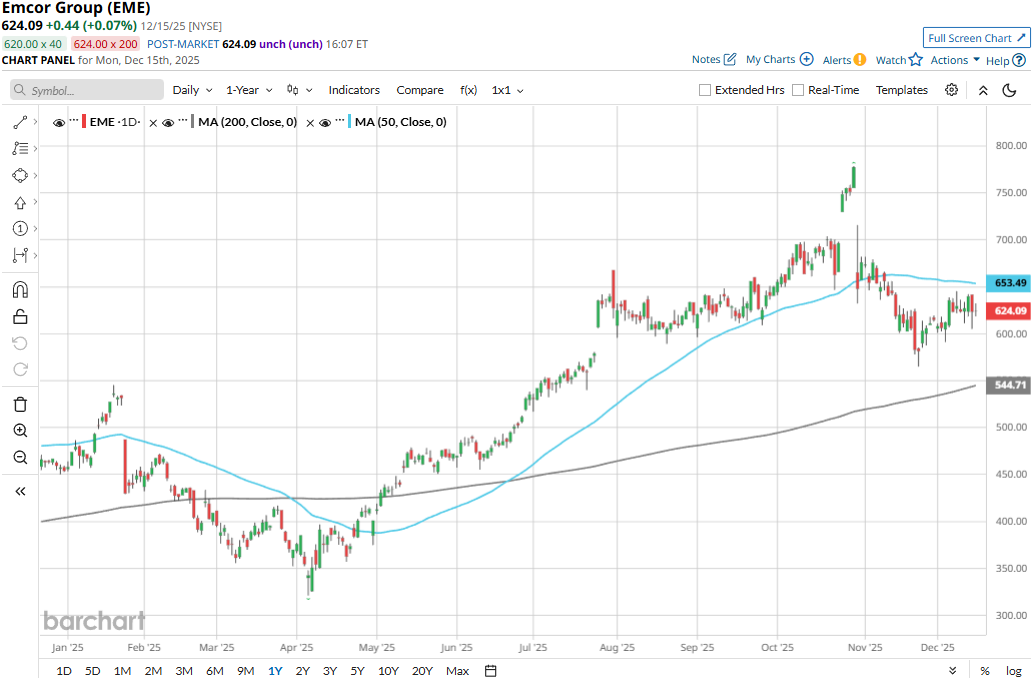
EMCOR touched its all-time high of $778.64 on Oct. 29 and is currently trading 19.8% below that peak. Meanwhile, EME stock prices have observed a marginal 74 bps dip over the past three months, underperforming the S&P 500 Index’s ($SPX3% uptick during the same time frame.

www.barchart.com

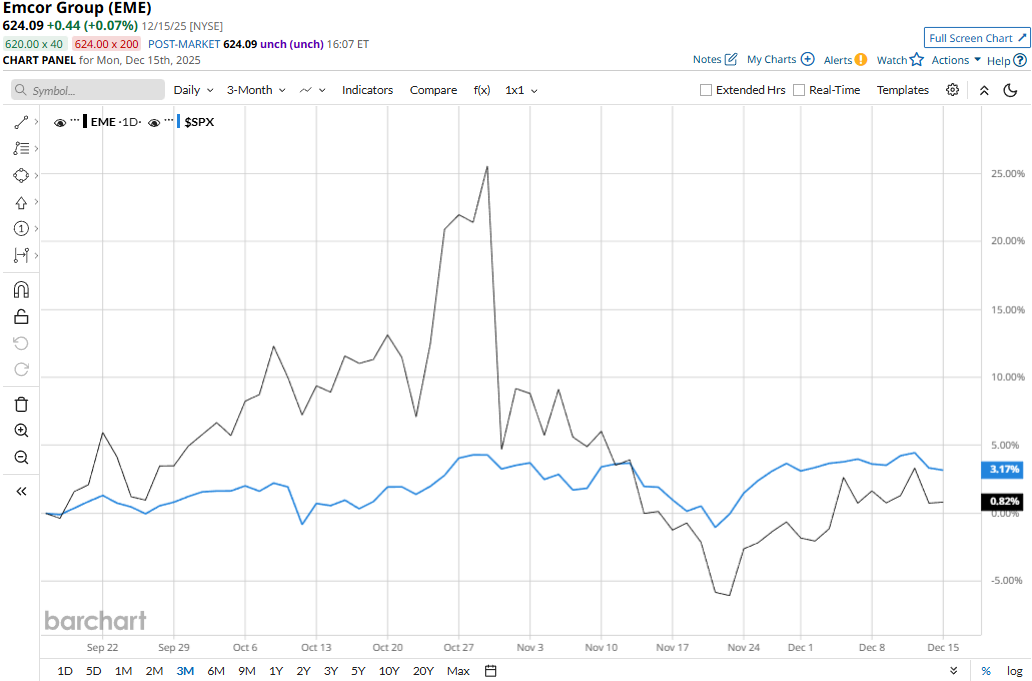
However, EMCOR’s performance has remained impressive over the longer term. EME stock prices have soared 37.5% on a YTD basis and 30.2% over the past 52 weeks, outperforming SPX’s 15.9% gains in 2025 and 12.7% returns over the past 52 weeks.

EME stock has traded consistently above its 200-day moving average since early May and dropped below its 50-day moving average in early November, underscoring its previous bullish trend and recent downturn.

www.barchart.com

Despite reporting a significant surge in topline and earnings, EMCOR Group’s stock prices plummeted 16.6% in the trading session following the release of its Q3 results on Oct. 30. The company observed an impressive 16.4% year-over-year surge in revenues to $4.3 billion, setting a record for Q3, but missed the Street’s expectations by 37 bps. Meanwhile, the company observed a slight decline in margins but reported a significant 13.3% growth in EPS to $6.57 and missed the consensus estimates by 1.2%.

While EMCOR’s financials missed expectations, it has a record $12.6 billion in remaining performance obligations, ensuring the company’s future growth trajectory. Following the initial decline, EME stock prices gained 4.3% in the subsequent trading session.

When compared to its peer, EME has lagged behind MasTec, Inc.’s (MTZ61.9% surge in 2025 and 59.9% gains over the past 52 weeks.

Among the 10 analysts covering the EME stock, the consensus rating is a “Moderate Buy.” As of writing, its mean price target of $721 suggests a 15.5% upside potential from current price levels.


On the date of publication, Aditya Sarawgi did not have (either directly or indirectly) positions in any of the securities mentioned in this article. All information and data in this article is solely for informational purposes. For more information please view the Barchart Disclosure Policy here.


More news from Barchart

Recent Quotes

View More
Symbol Price Change (%)
AMZN  221.27
-1.29 (-0.58%)
AAPL  271.84
-2.77 (-1.01%)
AMD  198.11
-11.06 (-5.29%)
BAC  54.55
-0.26 (-0.47%)
GOOG  298.05
-9.68 (-3.15%)
META  649.50
-7.65 (-1.16%)
MSFT  476.12
-0.27 (-0.06%)
NVDA  170.94
-6.78 (-3.81%)
ORCL  178.46
-10.19 (-5.40%)
TSLA  467.26
-22.62 (-4.62%)
Stock Quote API & Stock News API supplied by www.cloudquote.io
Quotes delayed at least 20 minutes.
By accessing this page, you agree to the Privacy Policy and Terms Of Service.


IntelligentValue Home
Close Window

DISCLAIMER

All content herein is issued solely for informational purposes and is not to be construed as an offer to sell or the solicitation of an offer to buy, nor should it be interpreted as a recommendation to buy, hold or sell (short or otherwise) any security.  All opinions, analyses, and information included herein are based on sources believed to be reliable, but no representation or warranty of any kind, expressed or implied, is made including but not limited to any representation or warranty concerning accuracy, completeness, correctness, timeliness or appropriateness. We undertake no obligation to update such opinions, analysis or information. You should independently verify all information contained on this website. Some information is based on analysis of past performance or hypothetical performance results, which have inherent limitations. We make no representation that any particular equity or strategy will or is likely to achieve profits or losses similar to those shown. Shareholders, employees, writers, contractors, and affiliates associated with ETFOptimize.com may have ownership positions in the securities that are mentioned. If you are not sure if ETFs, algorithmic investing, or a particular investment is right for you, you are urged to consult with a Registered Investment Advisor (RIA). Neither this website nor anyone associated with producing its content are Registered Investment Advisors, and no attempt is made herein to substitute for personalized, professional investment advice. Neither ETFOptimize.com, Global Alpha Investments, Inc., nor its employees, service providers, associates, or affiliates are responsible for any investment losses you may incur as a result of using the information provided herein. Remember that past investment returns may not be indicative of future returns.

Copyright © 1998-2017 ETFOptimize.com, a publication of Optimized Investments, Inc. All rights reserved.