ETFOptimize | High-performance ETF-based Investment Strategies

Quantitative strategies, Wall Street-caliber research, and insightful market analysis since 1998.


ETFOptimize | HOME
Close Window

Is LKQ Stock Underperforming the Dow?

Antioch, Tennessee-based LKQ Corporation (LKQ) is a leading provider of alternative and specialty parts to repair and accessorize vehicles. With a market cap of $7.9 billion, LKQ operates through Wholesale-North America, Europe, Specialty, and Self-Service segments.

Companies worth between $2 billion and $10 billion are generally described as "mid-cap stocks." LKQ fits right into that category, with its market cap exceeding this threshold, reflecting its substantial size and influence in the auto parts industry. It offers a wide range of replacement systems, components, and equipment for automobiles, trucks, and recreational vehicles.


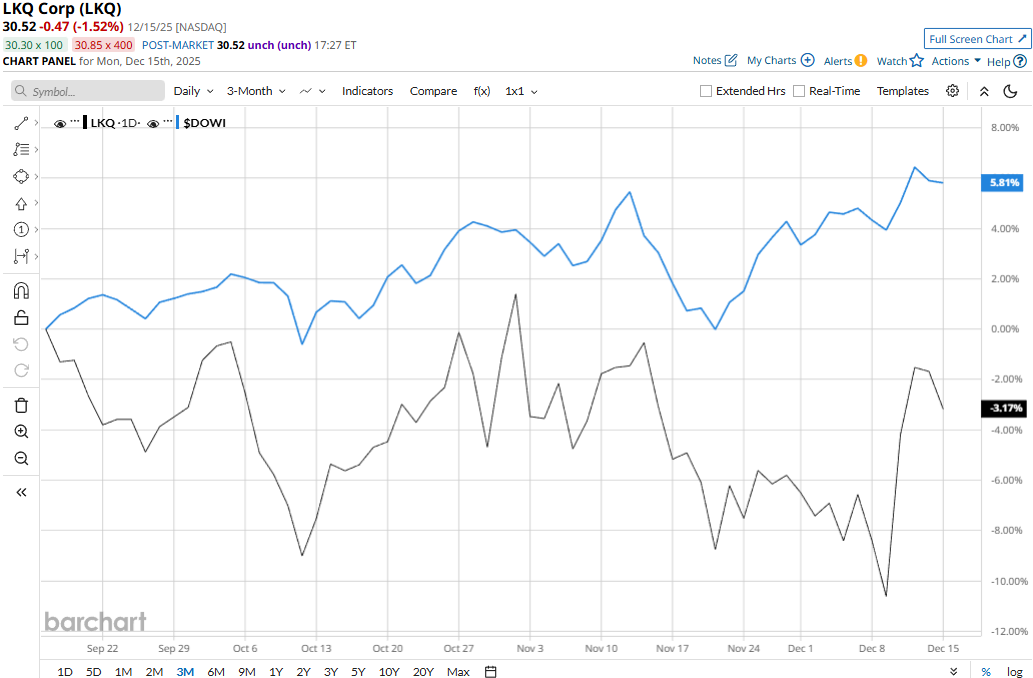
Despite its notable strengths, LKQ stock has dropped 31.9% from its 52-week high of $44.82 touched on Mar. 10. Meanwhile, LKQ stock prices have dipped 3.3% over the past three months, underperforming the Dow Jones Industrial Average’s ($DOWI5.5% uptick during the same time frame.

www.barchart.com

LKQ’s performance has remained grim over the longer term as well. LKQ stock prices have plunged 17% on a YTD basis and 19.6% over the past 52 weeks, compared to the Dow’s 13.8% gains in 2025 and 10.5% returns over the past year.

LKQ stock has traded mostly below its 50-day moving average since late April, with some fluctuations, and consistently below its 200-day moving average since mid-June, underscoring its bearish trend.

www.barchart.com

LKQ’s stock prices gained 3.7% in the trading session following the release of its mixed Q3 results on Oct. 30. The company observed a 1.2% decrease in parts and services organic revenues and a 30 bps net negative impact of acquisitions and divestitures. However, due to a positive impact of forex translation, the company’s overall topline increased 1.3% year-over-year to $3.5 billion, which fell 84 bps below Street’s expectations.

Meanwhile, due to a slight contraction in net margins, the company’s adjusted EPS decreased 2.3% year-over-year to $0.84, but surpassed the consensus estimates by a notable 13.5%.

When compared to its peer, LKQ has significantly outperformed Mobileye Global Inc.’s (MBLY47.1% decline on a YTD basis and 39.8% plunge over the past 52 weeks.

Among the 10 analysts covering the LKQ stock, the consensus rating is a “Moderate Buy.” As of writing, its mean price target of $41.19 suggests an approximate 35% upside potential from current price levels.


On the date of publication, Aditya Sarawgi did not have (either directly or indirectly) positions in any of the securities mentioned in this article. All information and data in this article is solely for informational purposes. For more information please view the Barchart Disclosure Policy here.


More news from Barchart

Recent Quotes

View More
Symbol Price Change (%)
AMZN  221.27
-1.29 (-0.58%)
AAPL  271.84
-2.77 (-1.01%)
AMD  198.11
-11.06 (-5.29%)
BAC  54.55
-0.26 (-0.47%)
GOOG  298.05
-9.68 (-3.15%)
META  649.50
-7.65 (-1.16%)
MSFT  476.12
-0.27 (-0.06%)
NVDA  170.94
-6.78 (-3.81%)
ORCL  178.46
-10.19 (-5.40%)
TSLA  467.26
-22.62 (-4.62%)
Stock Quote API & Stock News API supplied by www.cloudquote.io
Quotes delayed at least 20 minutes.
By accessing this page, you agree to the Privacy Policy and Terms Of Service.


IntelligentValue Home
Close Window

DISCLAIMER

All content herein is issued solely for informational purposes and is not to be construed as an offer to sell or the solicitation of an offer to buy, nor should it be interpreted as a recommendation to buy, hold or sell (short or otherwise) any security.  All opinions, analyses, and information included herein are based on sources believed to be reliable, but no representation or warranty of any kind, expressed or implied, is made including but not limited to any representation or warranty concerning accuracy, completeness, correctness, timeliness or appropriateness. We undertake no obligation to update such opinions, analysis or information. You should independently verify all information contained on this website. Some information is based on analysis of past performance or hypothetical performance results, which have inherent limitations. We make no representation that any particular equity or strategy will or is likely to achieve profits or losses similar to those shown. Shareholders, employees, writers, contractors, and affiliates associated with ETFOptimize.com may have ownership positions in the securities that are mentioned. If you are not sure if ETFs, algorithmic investing, or a particular investment is right for you, you are urged to consult with a Registered Investment Advisor (RIA). Neither this website nor anyone associated with producing its content are Registered Investment Advisors, and no attempt is made herein to substitute for personalized, professional investment advice. Neither ETFOptimize.com, Global Alpha Investments, Inc., nor its employees, service providers, associates, or affiliates are responsible for any investment losses you may incur as a result of using the information provided herein. Remember that past investment returns may not be indicative of future returns.

Copyright © 1998-2017 ETFOptimize.com, a publication of Optimized Investments, Inc. All rights reserved.