ETFOptimize | High-performance ETF-based Investment Strategies

Quantitative strategies, Wall Street-caliber research, and insightful market analysis since 1998.


ETFOptimize | HOME
Close Window

Is Ralph Lauren Stock Outperforming the S&P 500?

With a market cap of $22.5 billion, Ralph Lauren Corporation (RL) is a global lifestyle brand that designs, markets, and distributes premium apparel, accessories, home products, and fragrances worldwide. Its diverse portfolio includes well-known brands such as Polo Ralph Lauren, Ralph Lauren Collection, Purple Label, Double RL, Lauren Ralph Lauren, and Chaps, along with a wide range of men’s, women’s, and children’s products. 

Companies valued over $10 billion are generally described as “large-cap” stocks, and Ralph Lauren fits right into that category. The company reaches consumers through department and specialty stores, directly operated retail locations, digital commerce platforms, and distinctive restaurant and hospitality concepts worldwide.


Shares of the New York-based company have fallen 1.6% from its 52-week high of $377.72. Ralph Lauren’s shares have increased 17.7% over the past three months, outpacing the broader S&P 500 Index’s ($SPX) 3% gain over the same time frame.

www.barchart.com

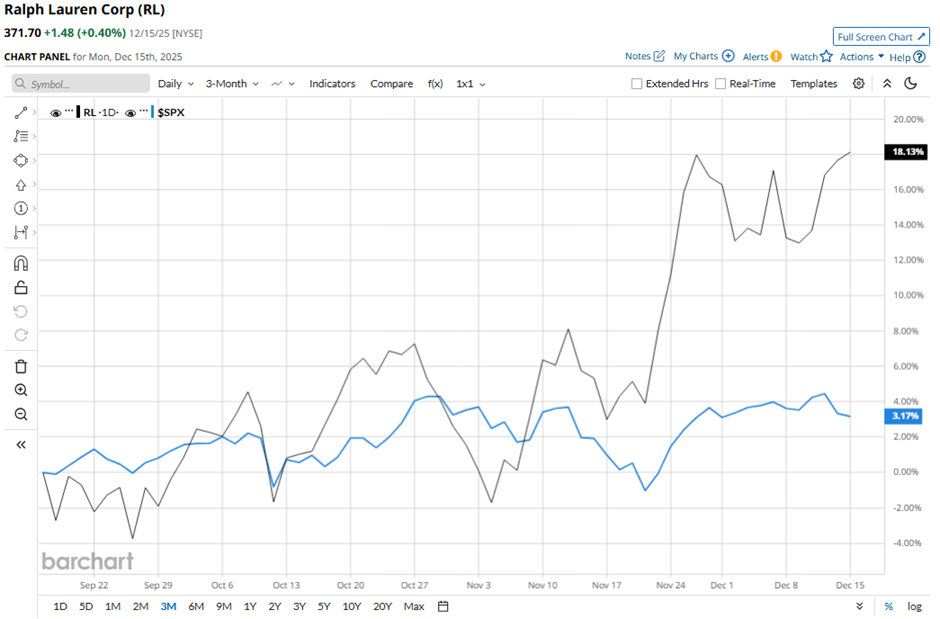
In the longer term, RL stock is up 60.9% on a YTD basis, surpassing SPX’s 15.9% rise. Moreover, shares of the company have climbed 63.4% over the past 52 weeks, compared to the 12.7% return of the SPX over the same time frame.

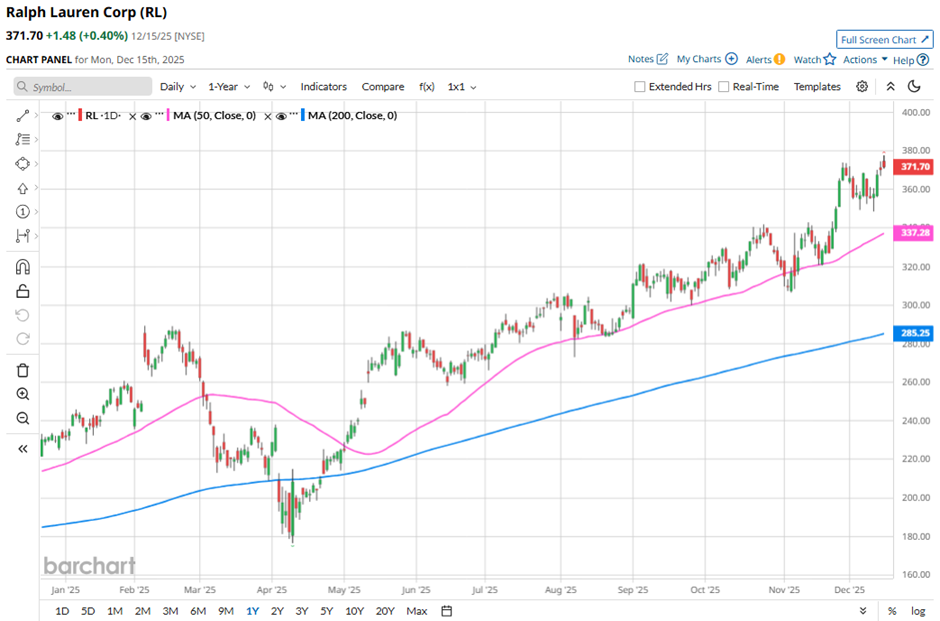
The stock has been trading above its 50-day and 200-day moving averages since last year.

www.barchart.com

Ralph Lauren posted better-than-expected Q2 2026 results on Nov. 6, with revenue up 17% reported to $2 billion and adjusted EPS rising 49% year-over-year to $3.79, well above prior-year levels. The management also raised its full-year fiscal 2026 outlook, forecasting 5% - 7% constant-currency revenue growth and 60 basis points - 80 basis points of operating margin expansion. However, the stock fell marginally on that day.

In comparison, rival Levi Strauss & Co. (LEVI) has lagged behind RL stock. LEVI stock has soared 26.8% on a YTD basis and 28.2% over the past 52 weeks.

Due to the stock’s strong performance over the past year, analysts remain bullish on RL. It has a consensus rating of “Strong Buy” from the 19 analysts in coverage, and the mean price target of $381.81 is a premium of 2.7% to current levels.


On the date of publication, Sohini Mondal did not have (either directly or indirectly) positions in any of the securities mentioned in this article. All information and data in this article is solely for informational purposes. For more information please view the Barchart Disclosure Policy here.


More news from Barchart

Recent Quotes

View More
Symbol Price Change (%)
AMZN  221.27
-1.29 (-0.58%)
AAPL  271.84
-2.77 (-1.01%)
AMD  198.11
-11.06 (-5.29%)
BAC  54.55
-0.26 (-0.47%)
GOOG  298.06
-9.67 (-3.14%)
META  649.50
-7.65 (-1.16%)
MSFT  476.12
-0.27 (-0.06%)
NVDA  170.94
-6.78 (-3.81%)
ORCL  178.46
-10.19 (-5.40%)
TSLA  467.26
-22.62 (-4.62%)
Stock Quote API & Stock News API supplied by www.cloudquote.io
Quotes delayed at least 20 minutes.
By accessing this page, you agree to the Privacy Policy and Terms Of Service.


IntelligentValue Home
Close Window

DISCLAIMER

All content herein is issued solely for informational purposes and is not to be construed as an offer to sell or the solicitation of an offer to buy, nor should it be interpreted as a recommendation to buy, hold or sell (short or otherwise) any security.  All opinions, analyses, and information included herein are based on sources believed to be reliable, but no representation or warranty of any kind, expressed or implied, is made including but not limited to any representation or warranty concerning accuracy, completeness, correctness, timeliness or appropriateness. We undertake no obligation to update such opinions, analysis or information. You should independently verify all information contained on this website. Some information is based on analysis of past performance or hypothetical performance results, which have inherent limitations. We make no representation that any particular equity or strategy will or is likely to achieve profits or losses similar to those shown. Shareholders, employees, writers, contractors, and affiliates associated with ETFOptimize.com may have ownership positions in the securities that are mentioned. If you are not sure if ETFs, algorithmic investing, or a particular investment is right for you, you are urged to consult with a Registered Investment Advisor (RIA). Neither this website nor anyone associated with producing its content are Registered Investment Advisors, and no attempt is made herein to substitute for personalized, professional investment advice. Neither ETFOptimize.com, Global Alpha Investments, Inc., nor its employees, service providers, associates, or affiliates are responsible for any investment losses you may incur as a result of using the information provided herein. Remember that past investment returns may not be indicative of future returns.

Copyright © 1998-2017 ETFOptimize.com, a publication of Optimized Investments, Inc. All rights reserved.