ETFOptimize | High-performance ETF-based Investment Strategies

Quantitative strategies, Wall Street-caliber research, and insightful market analysis since 1998.


ETFOptimize | HOME
Close Window

MGM Resorts Stock: Is MGM Outperforming the Consumer Discretionary Sector?

Valued at a market cap of $10.2 billion, MGM Resorts International (MGM) is a hospitality, gaming, and entertainment company headquartered in Las Vegas, Nevada. It owns and operates a portfolio of iconic integrated resort properties that combine luxury hotels, casino gaming, convention space, live entertainment, dining, nightlife, and retail experiences. 

Companies worth $10 billion or more are typically classified as “large-cap stocks,” and MGM fits the label perfectly, with its market cap exceeding this threshold, underscoring its size, influence, and dominance within the resorts & casinos industry. The company has a growing digital footprint through sports betting and online gaming platforms, positioning it to benefit from both destination travel demand and the expansion of legalized gaming and digital wagering.


This resort and casino company is currently trading 9.5% below its 52-week high of $41.32, reached on Feb. 14. Shares of MGM have gained 4.9% over the past three months, outperforming the State Street Consumer Discretionary Select Sector SPDR ETF’s (XLY1.2% rise during the same time frame.

www.barchart.com 

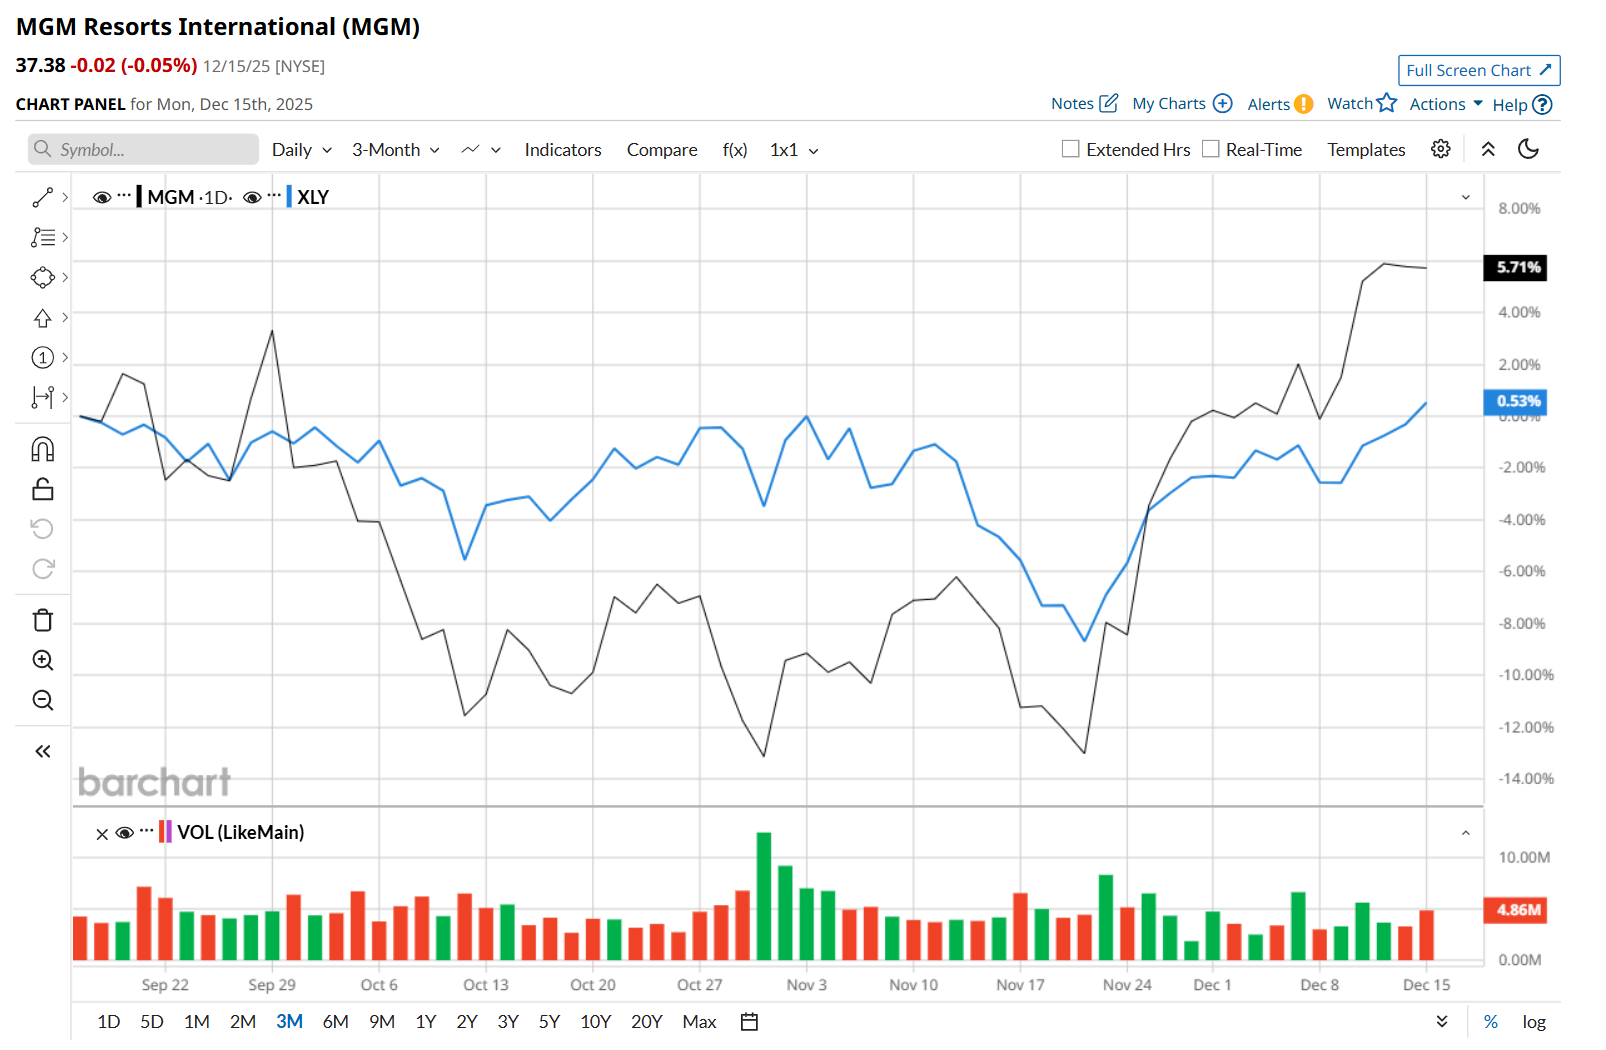
However, in the longer term, MGM has gained 3.1% over the past 52 weeks, slightly trailing behind XLY’s 3.4% uptick over the same time frame. Moreover, on a YTD basis, shares of MGM are up 7.9%, compared to XLY’s 8.5% return. 

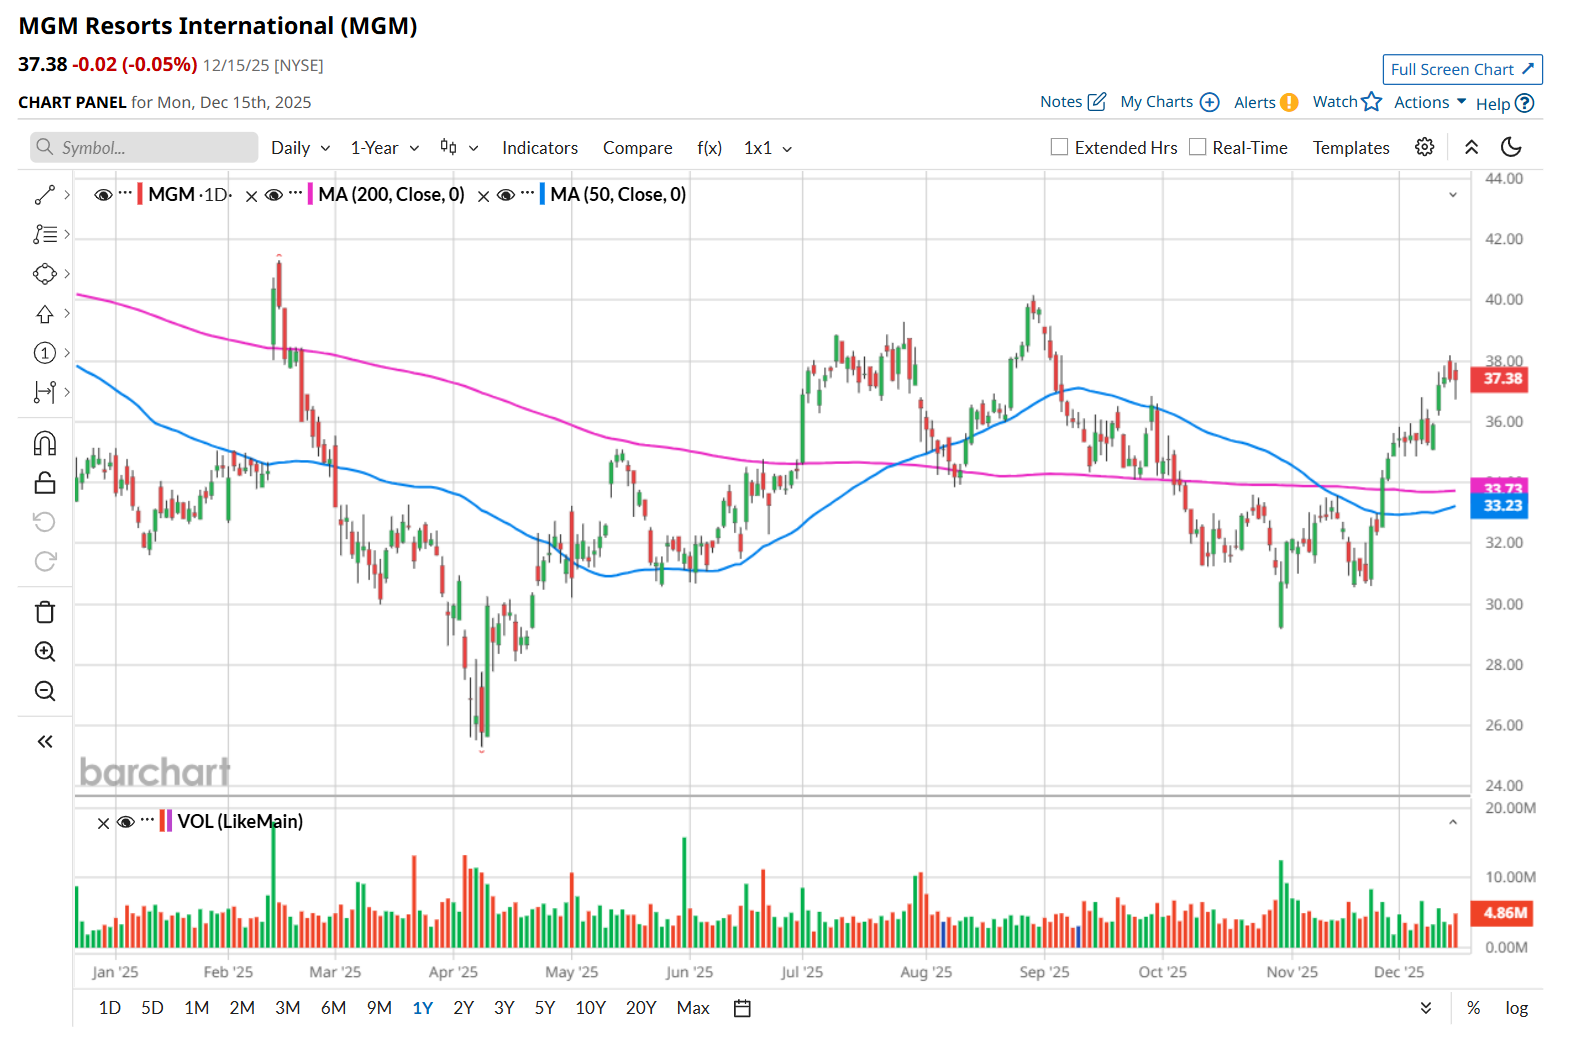
To confirm its recent bullish trend, MGM has been trading above its 200-day and 50-day moving averages since late November. 

www.barchart.com 

On Oct. 29, MGM’s shares plunged 2.3% after reporting mixed Q3 results. Primarily due to an increase in net revenues at MGM China, the company’s total revenue improved 2% year-over-year to $4.3 billion, surpassing consensus estimates by a slight margin.  However, its adjusted EPS of $0.24 declined by a notable 55.6% from the year-ago quarter and fell short of Wall Street expectations of $0.37. 

MGM has lagged behind its rival, Las Vegas Sands Corp. (LVS), which soared 24.4% over the past 52 weeks 30.4% on a YTD basis. 

Looking at MGM’s recent outperformance, analysts remain moderately optimistic about its prospects. The stock has a consensus rating of "Moderate Buy” from the 20 analysts covering it, and the mean price target of $42, suggests a 12.4% premium to its current price levels. 


On the date of publication, Neharika Jain did not have (either directly or indirectly) positions in any of the securities mentioned in this article. All information and data in this article is solely for informational purposes. For more information please view the Barchart Disclosure Policy here.


More news from Barchart

Recent Quotes

View More
Symbol Price Change (%)
AMZN  221.27
+0.00 (0.00%)
AAPL  271.84
+0.00 (0.00%)
AMD  198.11
+0.00 (0.00%)
BAC  54.55
+0.00 (0.00%)
GOOG  298.06
+0.00 (0.00%)
META  649.50
+0.00 (0.00%)
MSFT  476.12
+0.00 (0.00%)
NVDA  170.94
+0.00 (0.00%)
ORCL  178.46
+0.00 (0.00%)
TSLA  467.26
+0.00 (0.00%)
Stock Quote API & Stock News API supplied by www.cloudquote.io
Quotes delayed at least 20 minutes.
By accessing this page, you agree to the Privacy Policy and Terms Of Service.


IntelligentValue Home
Close Window

DISCLAIMER

All content herein is issued solely for informational purposes and is not to be construed as an offer to sell or the solicitation of an offer to buy, nor should it be interpreted as a recommendation to buy, hold or sell (short or otherwise) any security.  All opinions, analyses, and information included herein are based on sources believed to be reliable, but no representation or warranty of any kind, expressed or implied, is made including but not limited to any representation or warranty concerning accuracy, completeness, correctness, timeliness or appropriateness. We undertake no obligation to update such opinions, analysis or information. You should independently verify all information contained on this website. Some information is based on analysis of past performance or hypothetical performance results, which have inherent limitations. We make no representation that any particular equity or strategy will or is likely to achieve profits or losses similar to those shown. Shareholders, employees, writers, contractors, and affiliates associated with ETFOptimize.com may have ownership positions in the securities that are mentioned. If you are not sure if ETFs, algorithmic investing, or a particular investment is right for you, you are urged to consult with a Registered Investment Advisor (RIA). Neither this website nor anyone associated with producing its content are Registered Investment Advisors, and no attempt is made herein to substitute for personalized, professional investment advice. Neither ETFOptimize.com, Global Alpha Investments, Inc., nor its employees, service providers, associates, or affiliates are responsible for any investment losses you may incur as a result of using the information provided herein. Remember that past investment returns may not be indicative of future returns.

Copyright © 1998-2017 ETFOptimize.com, a publication of Optimized Investments, Inc. All rights reserved.