Jacksonville, Florida-based Regency Centers Corporation (REG) is a prominent REIT. It owns, manages, and develops grocery-anchored shopping centers in affluent suburban areas across the U.S. With a market cap of $12.4 billion, Regency’s portfolio includes over 480 properties and community-focused spaces offering shopping, dining, and entertainment options.
Companies worth $10 billion or more are generally described as "large-cap stocks." Regency fits right into that category, with its market cap exceeding this threshold, reflecting its substantial size and influence in the retail REIT industry.
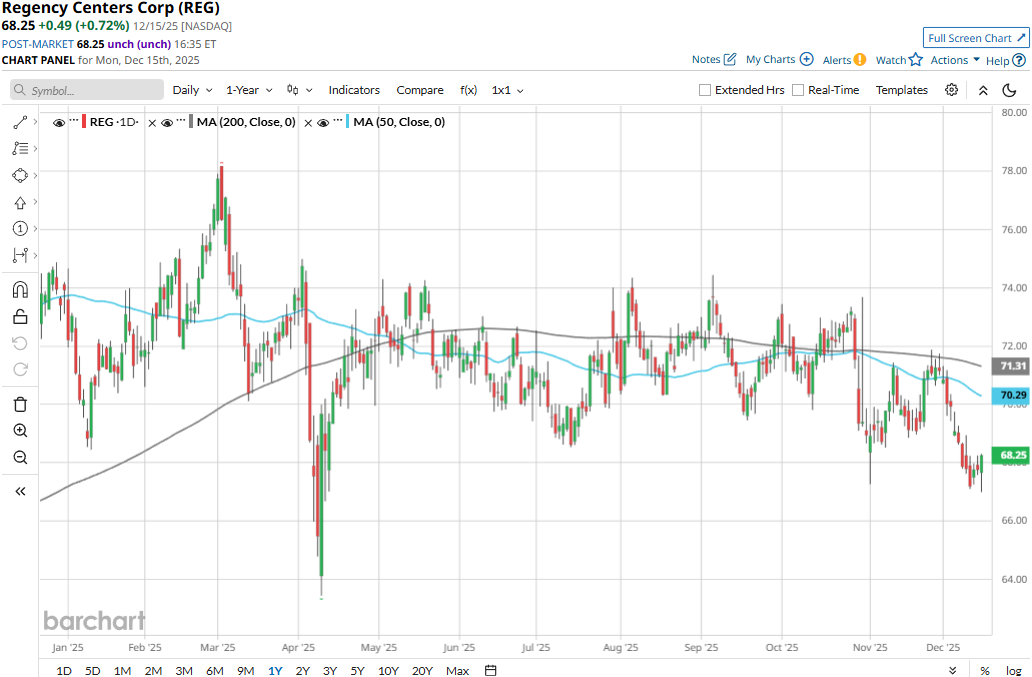
Regency touched its three-year high of $78.18 on Mar. 4 and is currently trading 12.7% below that peak. Meanwhile, REG stock prices have declined 3.8% over the past three months, marginally lagging behind the Real Estate Select Sector SPDR Fund’s (XLRE) 3.3% dip during the same time frame.
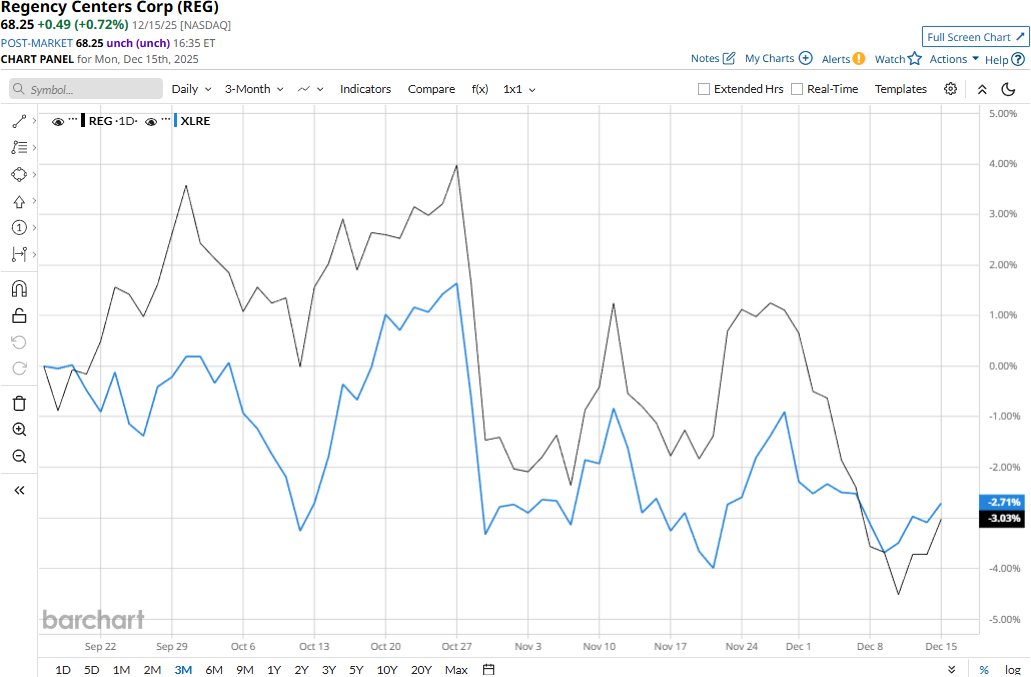
Regency’s performance has remained grim over the longer term as well. REG stock prices have dropped 7.7% on a YTD basis and declined 9.5% over the past 52 weeks, compared to XLRE’s marginal 59 bps uptick in 2025 and 4.5% dip over the past year.
REG stock has traded mostly below its 200-day moving average since early April, with some fluctuations, and plunged below its 50-day moving average in late October, underscoring its bearish trend.
Despite reporting better-than-expected revenues, Regency Centers’ stock prices declined 3.1% in the trading session following the release of its Q3 results on Oct. 28. Continuing its accretive investments, the company has made over $750 million of capital investments on a YTD basis, which has helped improve the company’s property portfolio. Driven by strong growth in lease income, Regency’s overall revenues for the quarter increased 7.7% year-over-year to $387.6 million, beating the consensus estimates by 60 bps.
Meanwhile, the company’s Nariet FFO per share grew 7.5% year-over-year to $1.15, meeting Street’s expectations. Further, observing the increase in the same property NOI, the company raised its full-year earnings growth guidance. Following the initial dip, REG stock maintained a positive momentum in the subsequent trading session.
When compared to its peer, Regency has notably outperformed Federal Realty Investment Trust’s (FRT) 9.9% decline on a YTD basis and 11.7% drop over the past 52 weeks.
Among the 20 analysts covering the REG stock, the consensus rating is a “Moderate Buy.” As of writing, its mean price target of $79.79 suggests a 16.9% upside potential from current price levels.
On the date of publication, Aditya Sarawgi did not have (either directly or indirectly) positions in any of the securities mentioned in this article. All information and data in this article is solely for informational purposes. For more information please view the Barchart Disclosure Policy here.
More news from Barchart


