Tapestry, Inc. (TPR), a prominent multinational fashion holding company, is headquartered in New York City. It manages luxury brands like Coach, Kate Spade, and Stuart Weitzman, focusing on designing, marketing, and distributing handbags, accessories, footwear, and apparel.
Operations center on e-commerce, wholesale partnerships, and distribution centers to drive innovation and direct-to-consumer growth worldwide. The company has a market capitalization of $25.21 billion, which classifies it as a “large-cap” stock.
Amid broader optimism, the company’s shares had reached a 52-week high of $125.73 on Dec. 15, and are down only 1.7% from that level. Due to strong sentiments surrounding Tapestry and its optimism about its “Amplify” growth strategy, its stock gained 12.2% over the past three months. On the other hand, the State Street Consumer Discretionary Select Sector SPDR ETF (XLY) is up 1.2% over the same period. Therefore, the stock has outperformed its sector over this period.
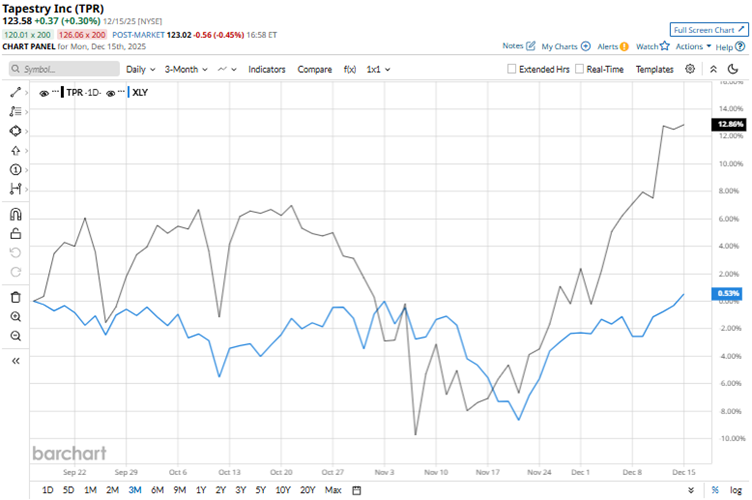
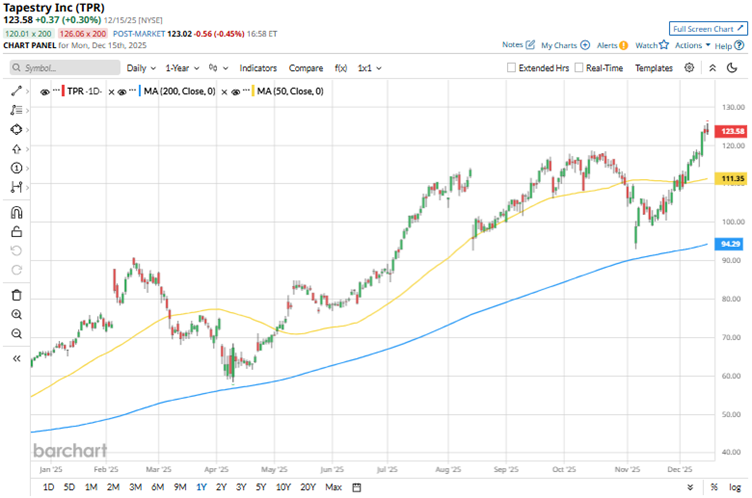
Over a more extended period, this outperformance persists. Over the past 52 weeks, Tapestry’s stock has gained 95.5%, while it has been up 56.6% over the past six months. By contrast, the Consumer Discretionary Select Sector ETF has increased by 3.4% and 15% over the same periods, respectively. Tapestry’s shares have consistently traded above its 200-day moving average over the past year and have been above its 50-day moving average since early December.
On Nov. 6, Tapestry reported its first-quarter results for fiscal 2026 (quarter ended Sept. 27). The company’s net sales increased 13% year-over-year (YOY) to $1.70 billion, which is higher than the $1.64 billion that Wall Street analysts had expected. The company acquired 2.2 million new customers globally, driven by the growth of Gen Z consumers.
This is also reflected in Tapestry’s bottom line, as its EPS increased 61% YOY to $1.28, exceeding the $1.25 that analysts predicted. Its adjusted EPS grew 35% YOY to $1.38. Despite this, the stock dropped 9.6% intraday on Nov. 6.
Tapestry also raised its fiscal 2026 revenue to approximately $7.30 billion, reflecting a 4%-5% increase over the prior year. Adjusted EPS is projected to be in the range of $5.45 to $5.60, representing 7% to 10% growth.
We compare Tapestry’s performance with that of another luxury goods stock, Signet Jewelers Limited (SIG), which has gained 3% over the past 52 weeks and 13.2% over the past six months. Therefore, Tapestry has been the clear outperformer over these periods.
Wall Street analysts are moderately bullish on Tapestry’s stock. The stock has a consensus rating of “Moderate Buy” from the 20 analysts covering it. The mean price target of $124.83 indicates a 1% upside compared to current levels. The Street-high price target of $148 indicates a 19.8% upside.
On the date of publication, Anushka Dutta did not have (either directly or indirectly) positions in any of the securities mentioned in this article. All information and data in this article is solely for informational purposes. For more information please view the Barchart Disclosure Policy here.
More news from Barchart


