With a market capitalization of $13.5 billion, Masco Corporation (MAS) is an industrial company and a leading manufacturer of branded home improvement and building products. Headquartered in Livonia, Michigan, Masco operates globally with a substantial manufacturing and distribution footprint.
Companies worth $10 billion or more are generally described as "large-cap stocks," and MAS fits the criterion. Masco is recognized for its strong brand portfolio and market share in plumbing and decorative products, supported by strategic partnerships with major retail outlets. The company leverages a decentralized operating model focused on continuous improvement and customer-centric innovation to drive long-term value.
MAS touched its 52-week high of $82.18 on Jan. 27, but has since retreated, now trading 21.2% below that peak. Over the past three months, the stock has plunged 11.6%, underperfoming the SPDR S&P Homebuilders ETF’s (XHB) 7.3% dip over the same period.
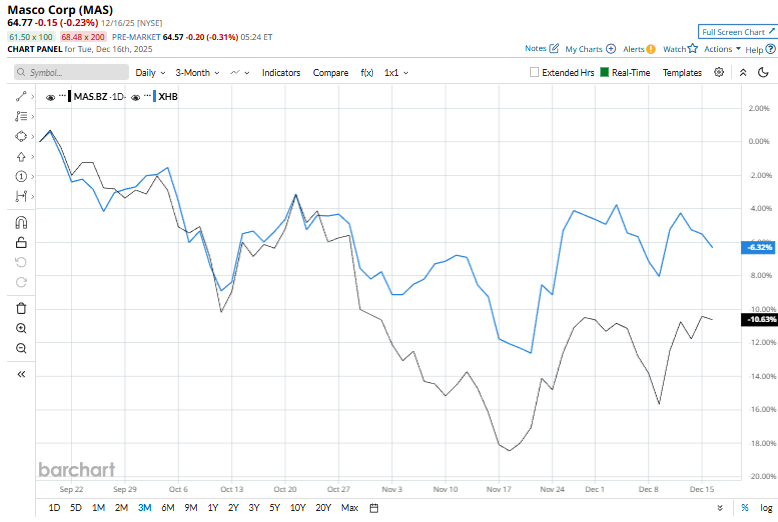
The weakness is also evident over longer time frames. MAS is down 16.7% over the past 52 weeks and has declined 10.8% year to date, in contrast to XHB’s 5.8% gain over the past year and 2.1% year-to-date gain.
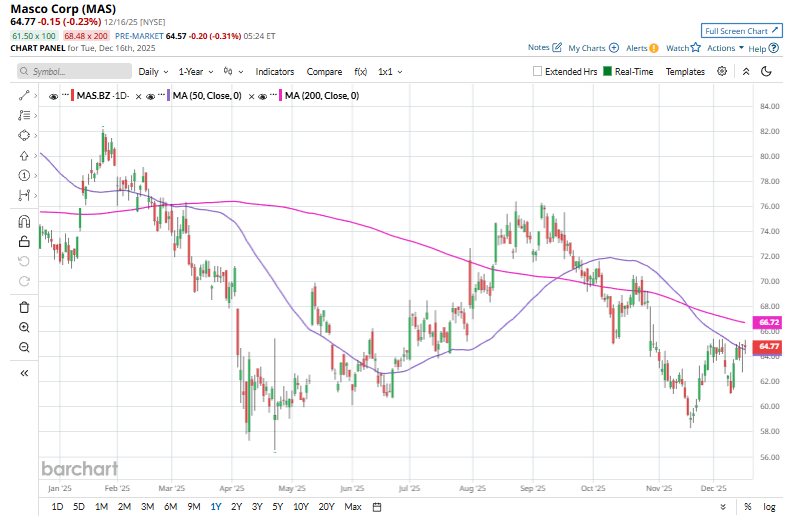
Additionally, stock has remained below both its 50-day and 200-day moving averages since late September and early October, respectively, signaling a sustained downtrend.
Masco’s underperformance relative to the broader market has been driven by soft end-market demand and macro headwinds. Weaker housing activity and muted renovation spending have weighed on sales volumes, particularly in decorative architectural products. At the same time, tariff exposure and higher input costs have raised concerns about margin pressure, prompting analyst downgrades and price-target cuts.
On Oct. 29, MAS shares dwindled 4.7% after reporting its Q3 results, which reflected a challenging operating environment. The company reported net sales of $1.92 billion, down 3% year over year, missing analyst expectations. Adjusted earnings per share came in at $0.97, below consensus forecasts and down from the prior year, while gross and operating margins contracted due to higher costs, including tariffs and commodity pressures.
MAS has also lagged behind its top competitor, Armstrong World Industries, Inc. (AWI), which has posted a 20.7% gain over the past 52 weeks and 30.7% returns in 2025.
Among 21 analysts covering the stock, the consensus rating is “Moderate Buy,” with a mean price target of $73.89, implying a premium of 14.1% from current levels.
On the date of publication, Kritika Sarmah did not have (either directly or indirectly) positions in any of the securities mentioned in this article. All information and data in this article is solely for informational purposes. For more information please view the Barchart Disclosure Policy here.
More news from Barchart
- This Growth Stock With 137% Upside Faces New Challenge: Buy, Hold or Sell?
- How to Buy CSCO for a 2.5% Discount, or Achieve a 19% Annual Return
- S&P Futures Gain as Investors Weigh U.S. Jobs Data, Fed Speak and Micron Earnings in Focus
- This High-Yield Dividend Stock Trades at a Third of Its Record Highs: Is It a Buy for 2026?


