Lennox International Inc. (LII), headquartered in Richardson, Texas, designs, manufactures, and markets products for the heating, ventilation, air conditioning, and refrigeration markets. Valued at $17.4 billion by market cap, the company sells its products and services through direct sales, distributors, and company-owned parts and supplies stores.
Companies worth $10 billion or more are generally described as “large-cap stocks,” and LII perfectly fits that description, with its market cap exceeding this mark, underscoring its size, influence, and dominance within the building products & equipment industry. LII excels in the HVACR industry with its flagship brand, known for quality and reliability. By focusing on North America, the company has streamlined operations and reinforced its market position, leveraging strong brand recognition and customer loyalty.
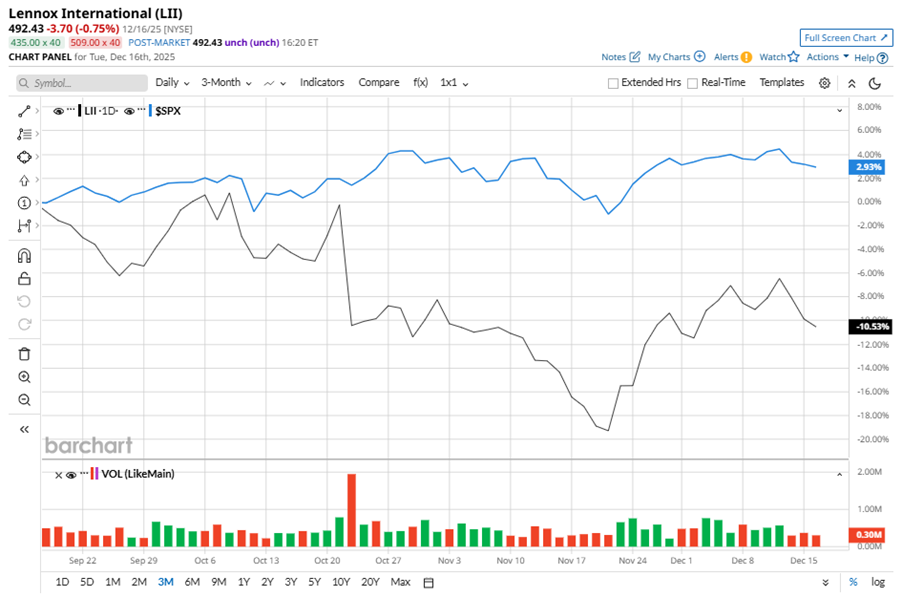
Despite its notable strength, LII slipped 28.6% from its 52-week high of $689.44, achieved on Jul. 23. Over the past three months, LII stock has declined 10.5%, underperforming the S&P 500 Index’s ($SPX) 2.9% gains during the same time frame.
In the longer term, shares of LII dipped 9.5% on a six-month basis and fell 26.3% over the past 52 weeks, considerably underperforming SPX’s six-month gains of 12.7% and 12% returns over the same time frame.
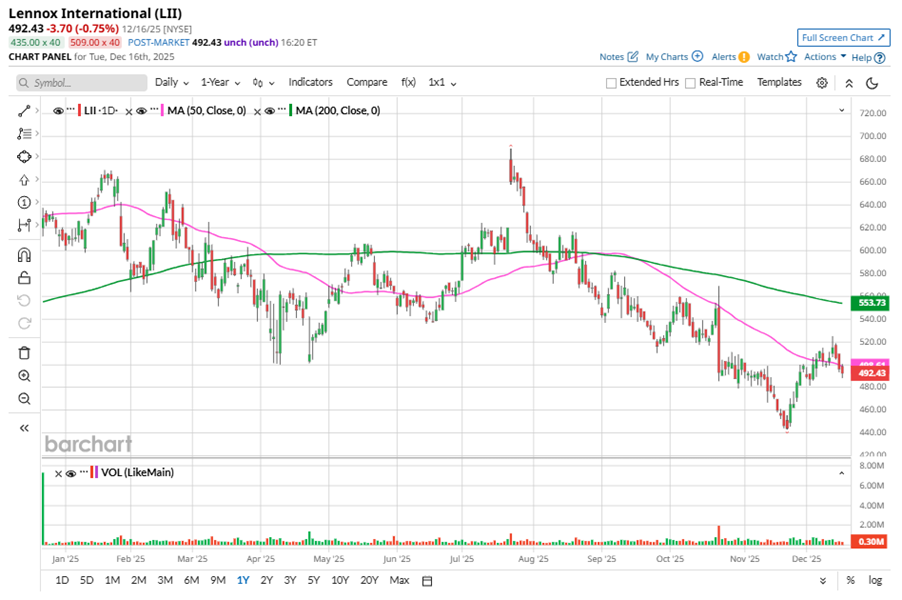
To confirm the bearish trend, LII has been trading below its 50-day moving average since late August, with slight fluctuations. The stock has been trading below its 200-day moving average since early August, with slight fluctuations.
LII is underperforming due to soft demand in residential and commercial HVAC markets, with declining industry shipments and inventory destocking among distributors and dealers. Its regulatory changes, tariff exposure concerns, and a shift towards repairs over replacements are also weighing on the company.
On Oct. 22, LII shares closed down more than 10% after reporting its Q3 results. Its EPS of $6.98 surpassed Wall Street expectations of $6.69. The company’s revenue was $1.4 billion, falling short of Wall Street forecasts of $1.5 billion. LII expects full-year EPS in the range of $22.75 to $23.25.
In the competitive arena of building products & equipment, Trane Technologies plc (TT) has taken the lead over LII, with 7.2% losses over the past six months and a marginal decline over the past 52 weeks.
Wall Street analysts are reasonably bullish on LII’s prospects. The stock has a consensus “Moderate Buy” rating from the 18 analysts covering it, and the mean price target of $570 suggests a potential upside of 15.8% from current price levels.
On the date of publication, Neha Panjwani did not have (either directly or indirectly) positions in any of the securities mentioned in this article. All information and data in this article is solely for informational purposes. For more information please view the Barchart Disclosure Policy here.
More news from Barchart
- This Growth Stock With 137% Upside Faces New Challenge: Buy, Hold or Sell?
- How to Buy CSCO for a 2.5% Discount, or Achieve a 19% Annual Return
- S&P Futures Gain as Investors Weigh U.S. Jobs Data, Fed Speak and Micron Earnings in Focus
- This High-Yield Dividend Stock Trades at a Third of Its Record Highs: Is It a Buy for 2026?


