nshohocken, Pennsylvania-based Cencora, Inc. (COR) is a leading global pharmaceutical-services company that plays a critical role in the healthcare supply chain by sourcing, distributing, and managing logistics for branded, generic, specialty, and over-the-counter medicines. Valued at $58.7 billion by market cap, the company offers end-to-end pharmaceutical commercialization solutions, over-the-counter healthcare products, home healthcare supplies and equipment, and related services to healthcare providers.
Companies worth $10 billion or more are generally described as “large-cap stocks.” COR effortlessly fits that bill, with its market cap exceeding this mark, underscoring its size, influence, and dominance within the medical distribution industry. Cencora’s strength lies in its strategic role within the healthcare value chain, supported by its diversified portfolio and scale-driven bargaining power. The company leverages cross-business synergies, strong brand equity, and a solid balance sheet to enhance innovation and operational performance.
Despite its notable strength, COR slipped 7.1% from its 52-week high of $377.54, achieved recently on Nov. 25. Over the past three months, COR stock has gained 18.9%, outperforming the Health Care Select Sector SPDR Fund’s (XLV) 12.2% gain during the same time frame.
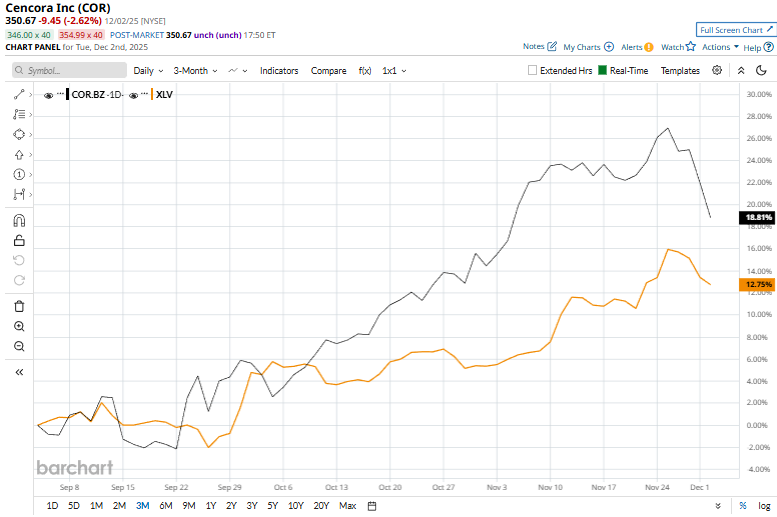
In the longer term, shares of COR rose 56.1% on a YTD basis and climbed 40.3% over the past 52 weeks, outperforming XLV’s YTD gains of 12.2% and 4.9% rise over the last year.
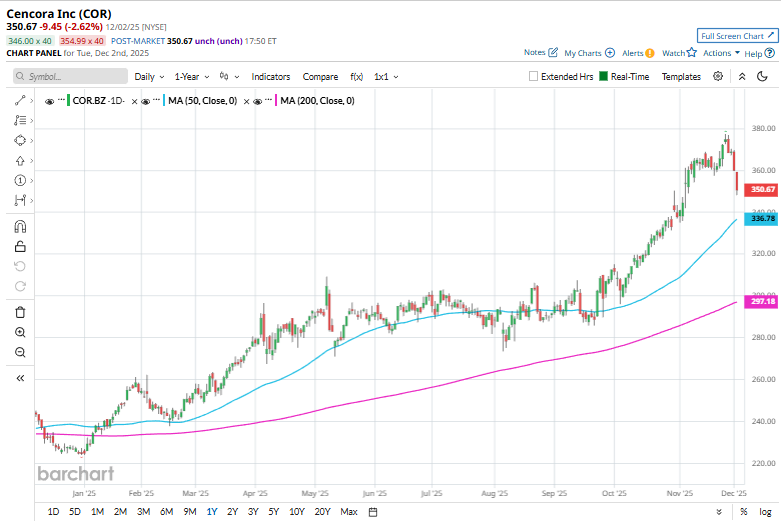
To confirm the bullish trend, COR has been trading above its 200-day moving average since early January. The stock has been trading above its 50-day moving average since the end of September.
Cencora’s shares climbed 2.8% in the trading session following the release of its strong Q3 results on Nov. 5, underscoring investor confidence in the company’s growth strategy and digital transformation initiatives. Revenue for the quarter rose 5.9% year-over-year to $83.7 billion, exceeding Wall Street expectations by 69 basis points, while adjusted EPS jumped 15% to $3.84, topping consensus estimates by 1.3%. The results reinforced Cencora’s strengthening momentum and its expanding influence within the healthcare ecosystem.
In the competitive arena of medical distribution, McKesson Corporation (MCK) has taken the lead over COR, showing resilience with a 33.5% uptick over the past 52 weeks but lagging behind the stock with 45.6% gains on a YTD basis.
Wall Street analysts are bullish on COR’s prospects. The stock has a consensus “Strong Buy” rating from the 15 analysts covering it, and the mean price target of $387.64 suggests a potential upside of 10.5% from current price levels.
On the date of publication, Kritika Sarmah did not have (either directly or indirectly) positions in any of the securities mentioned in this article. All information and data in this article is solely for informational purposes. For more information please view the Barchart Disclosure Policy here.
More news from Barchart
- Deere Got Hit by Tariffs... Again. Should You Buy the Blue-Chip Dividend Stock on the Dip?
- The Tesla Europe Sales Rout Keeps Going. Is It Time to Sell TSLA Stock?
- Dear Nuclear Energy Stocks Fans, Mark Your Calendars for December 3
- Nvidia Just Lit a Fire Under Synopsys Stock But Its Chart Is Waving Red Flags. Here’s the Only Way I’d Trade SNPS Here.


