Valued at a market cap of $42.3 billion, Ameriprise Financial, Inc. (AMP) is a diversified financial services company based in Minneapolis, Minnesota. It specializes in wealth management, asset management, and retirement planning for individuals and institutions.
Companies valued at $10 billion or more are typically classified as “large-cap stocks,” and AMP fits the label perfectly, with its market cap exceeding this threshold, underscoring its size, influence, and dominance within the asset management industry. With a focus on personalized advice, disciplined capital management, and strong advisor productivity, the company continues to position itself as a leading player in the industry.
This asset management company has slipped 21.5% from its 52-week high of $582.05, reached on Jan. 30. Shares of AMP have declined 10.9% over the past three months, considerably lagging behind the S&P 500 Index’s ($SPX) 6.5% rise during the same time frame.
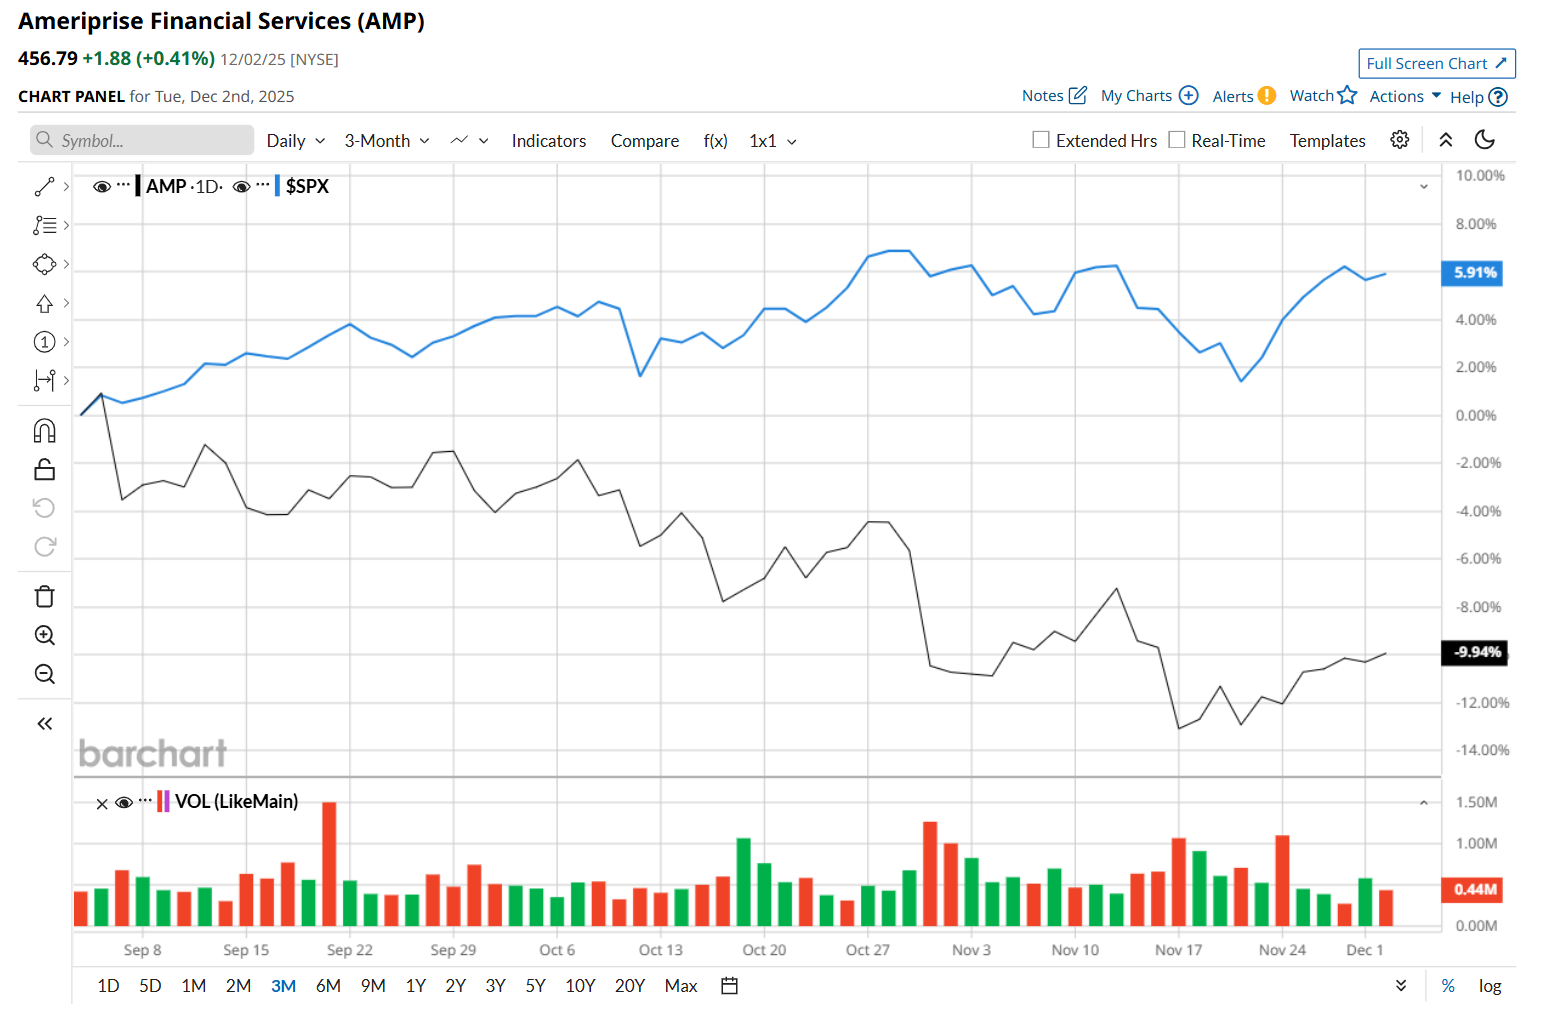
In the longer term, AMP has fallen 19.2% over the past 52 weeks, notably underperforming SPX's 12.9% uptick over the same time period. Moreover, on a YTD basis, shares of AMP are down 14.2%, compared to SPX’s 16.1% return.
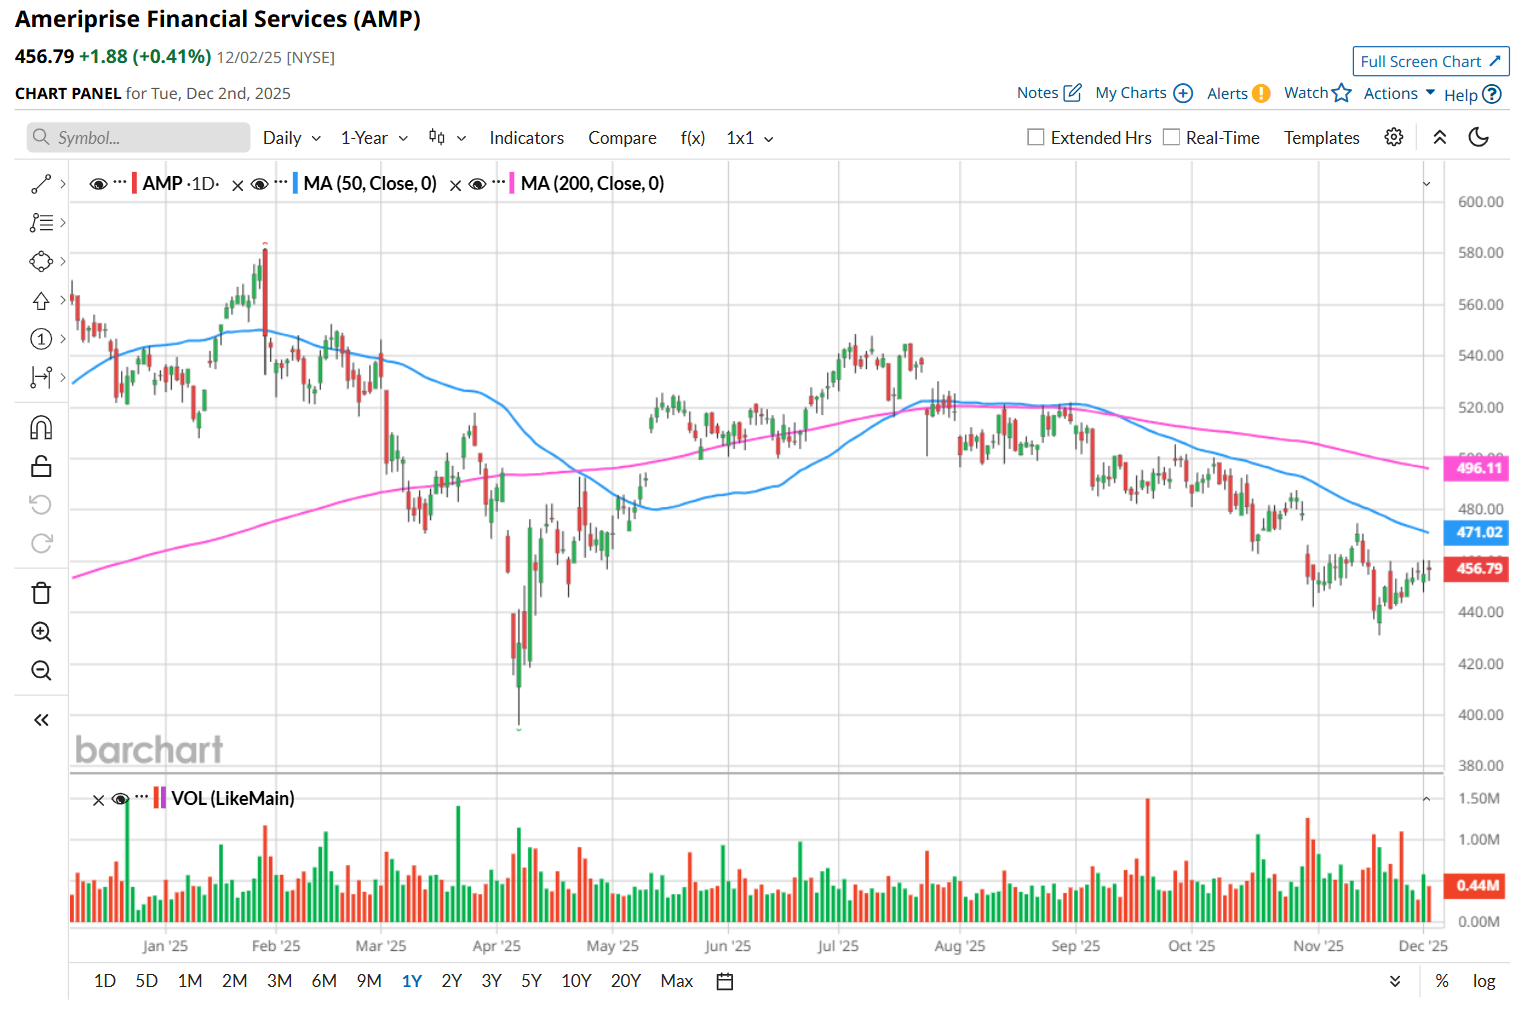
To confirm its bearish trend, AMP has been trading below its 200-day and 50-day moving averages since late July.
On Oct. 30, AMP delivered better-than-expected Q3 results. Due to solid growth in its management and financial advice fees, distribution fees, and premiums, policy, and contract charges, the company’s total net revenue improved 9% year-over-year to $4.8 billion, handily exceeding consensus estimates. Moreover, on the earnings front, its adjusted EPS also climbed 12.3% from the year-ago quarter to $9.92, beating analyst estimates by 3.3%. However, despite these positives, its shares plunged 5.1% after the earnings release.
AMP has also considerably lagged behind its rival, Raymond James Financial, Inc. (RJF), which declined 6.8% over the past 52 weeks and gained marginally on a YTD basis.
Looking at AMP’s recent underperformance, analysts remain cautious about its prospects. The stock has a consensus rating of "Hold” from the 15 analysts covering it, and the mean price target of $534 suggests a 16.9% premium to its current price levels.
On the date of publication, Neharika Jain did not have (either directly or indirectly) positions in any of the securities mentioned in this article. All information and data in this article is solely for informational purposes. For more information please view the Barchart Disclosure Policy here.
More news from Barchart
- Small-Cap Investment Firm Slumps to 52-Week Low: Opportunity or Red Flag?
- IonQ Wants to Bring Quantum Computing to Medicine. Should You Buy IONQ Stock Here?
- Jamie Dimon Once Called Bitcoin a ‘Fraud.’ Now, JPMorgan Is Quietly Making Blockchain History and Betting This ‘Crypto Winter’ Will Be Short-Lived.
- Down 41% From Its Highs, Should You Buy the Dip in MP Materials Stock?


