With a market cap of $51.5 billion, Dominion Energy, Inc. (D) is a leading U.S. provider of regulated electricity and natural gas services, operates through major segments in Virginia, South Carolina, and contracted renewable energy. The company serves millions of customers and manages extensive electric generation, transmission, and distribution infrastructure.
Companies valued at $10 billion or more are generally considered "large-cap" stocks, and Dominion Energy fits this criterion perfectly. As of December 31, 2024, its portfolio includes 30.3 GW of generating capacity and a vast network of transmission and distribution lines.
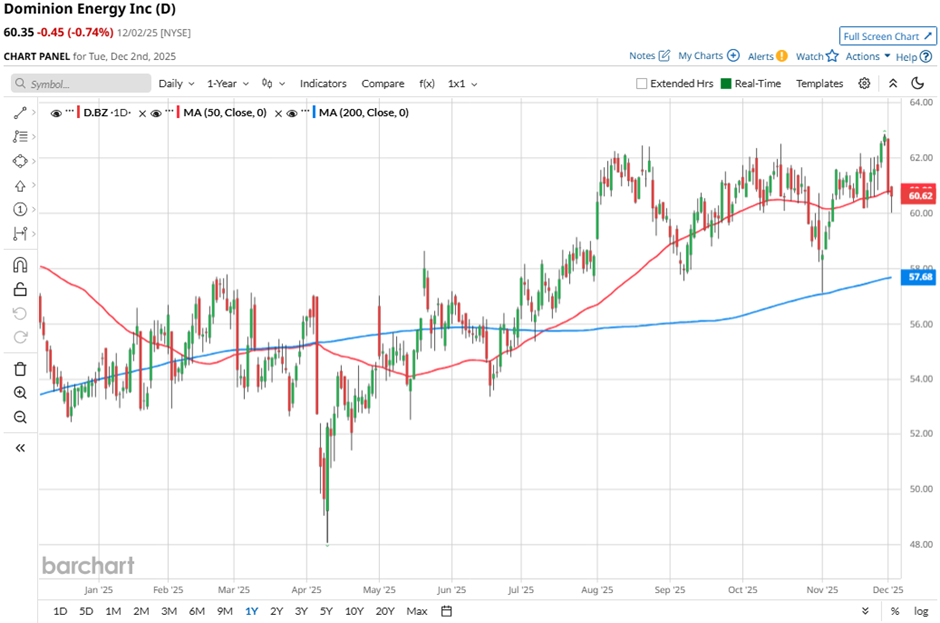
Shares of the Richmond, Virginia-based company have dipped over 4% from its 52-week high of $62.87. Shares of Dominion Energy have risen 2.1% over the past three months, underperforming the broader S&P 500 Index’s ($SPX) 6.5% gain during the same period.

Longer term, the energy company’s shares have gained 12.1% on a YTD basis, lagging behind SPX's 16.1% increase. Also, D stock has returned 5.3% over the past 52 weeks, compared to the 12.9% return of the SPX over the same time frame.
Despite a few fluctuations, the stock has been trading mostly above its 50-day moving average since May. In addition, it has moved above its 200-day moving average since July.
Despite delivering better-than-expected Q3 2025 adjusted EPS of $1.06 and revenue of $4.53 billion, Dominion Energy’s stock fell 1.4% on Oct. 31. The company narrowed its full-year operating earnings guidance to $3.33 per share - $3.48 per share, signaling limited upside even as it maintained the midpoint of $3.40.
In comparison, Dominion Energy stock has lagged behind its rival NextEra Energy, Inc. (NEE). NEE stock has soared 9.7% over the past 52 weeks and nearly 18% on a YTD basis..
Due to the stock’s underperformance, analysts are cautious with a consensus rating of "Hold" from 20 analysts. The mean price target of $64.86 is a premium of 7.5% to current levels.
On the date of publication, Sohini Mondal did not have (either directly or indirectly) positions in any of the securities mentioned in this article. All information and data in this article is solely for informational purposes. For more information please view the Barchart Disclosure Policy here.
More news from Barchart
- Dan Ives Says AI Bubble Fears Are ‘Overblown’ and He’s Betting on This 1 Data Center Stock Now
- S&P Futures Tick Higher With U.S. Economic Data in Focus
- Deere Got Hit by Tariffs... Again. Should You Buy the Blue-Chip Dividend Stock on the Dip?
- The Tesla Europe Sales Rout Keeps Going. Is It Time to Sell TSLA Stock?


