With a market cap of $33.1 billion, Lennar Corporation (LEN) is one of the largest homebuilders in the United States. The company operates through multiple segments including Homebuilding, Financial Services, Multifamily, and Fund Investment, with core operations focused on constructing and selling single-family homes, as well as developing and managing multifamily rental properties.
Companies valued at $10 billion or more are generally classified as “large-cap” stocks, and Lennar fits this criterion perfectly. Lennar also provides residential mortgage financing, title, insurance, and closing services, catering to a wide range of buyers, including first-time, move-up, active adult, and luxury homebuyers.
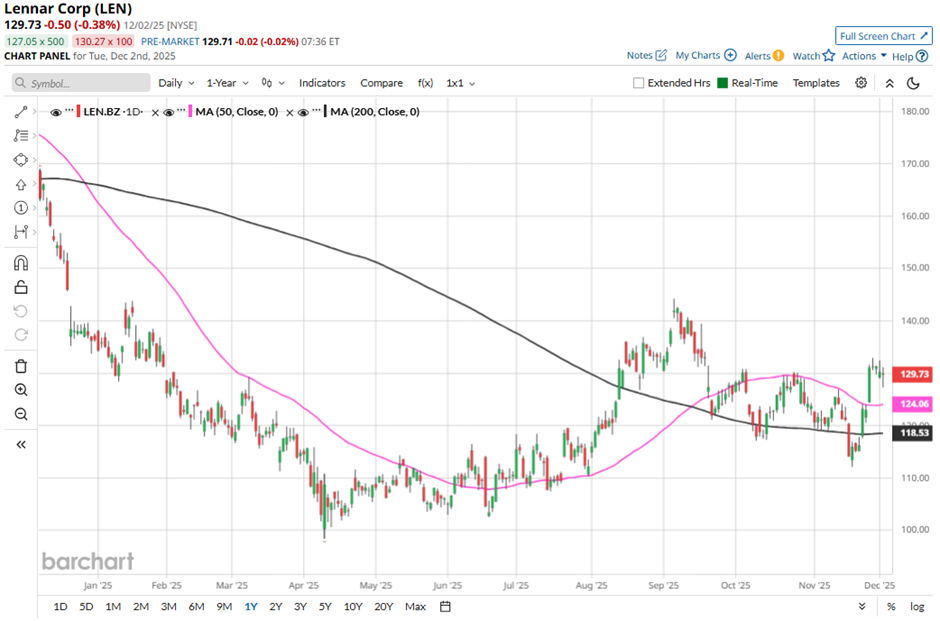
Shares of the Miami, Florida-based company have fallen 26.1% from its 52-week high of $175.65. Lennar’s shares have dropped 2.2% over the past three months, underperforming the broader Dow Jones Industrials Average's ($DOWI) 4.8% gain over the same time frame.

In the longer term, LEN stock is down 4.9% on a YTD basis, lagging behind DOWI’s 11.6% increase. In addition, shares of the homebuilder have decreased 25.2% over the past 52 weeks, compared to DOWI’s over 6% rise over the same time frame.
The stock has been trading below its 50-day moving average since late September. Yet, it has moved above its 200-day moving average since mid-August.
Shares of Lennar fell 4.2% following its Q3 2025 results on Sept. 18 as adjusted EPS of $2 missed Wall Street expectations of $2.12, and net earnings dropped sharply to $591 million from $1.2 billion a year earlier. Revenue of $8.81 billion also came in below forecasts and was down 9% year-over-year, reflecting a 9% decline in average home sales price to $383,000 and a gross margin drop to 17.5% from 22.5%. Investors were further concerned by guidance calling for flat margins (~17.5%) and lower new orders of 20,000 - 21,000 homes in Q4.
In comparison, LEN stock has performed weaker than its rival, D.R. Horton, Inc. (DHI). DHI stock has decreased 5.3% over the past 52 weeks and gained 13.3% on a YTD basis.
Due to the stock’s underperformance over the past year, analysts remain cautious on LEN. The stock has a consensus rating of “Hold” from the 19 analysts covering the stock, and as of writing, it is trading above the mean price target of $127.57.
On the date of publication, Sohini Mondal did not have (either directly or indirectly) positions in any of the securities mentioned in this article. All information and data in this article is solely for informational purposes. For more information please view the Barchart Disclosure Policy here.
More news from Barchart
- Down 41% From Its Highs, Should You Buy the Dip in MP Materials Stock?
- How to Use the Naked Put Options Strategy to Earn Income & Buy Stocks at a Discount
- Dan Ives Says AI Bubble Fears Are ‘Overblown’ and He’s Betting on This 1 Data Center Stock Now
- S&P Futures Tick Higher With U.S. Economic Data in Focus


