Valued at a market cap of $39.9 billion, Paychex, Inc. (PAYX) is a leading provider of human capital management (HCM) solutions for small and medium-sized businesses. The Rochester, New York-based company offers payroll processing, HR services, benefits administration, and workforce management through cloud-based platforms.
Companies valued at $10 billion or more are typically classified as “large-cap stocks,” and PAYX fits the label perfectly, with its market cap exceeding this threshold, underscoring its size, influence, and dominance within the software - application industry. The company generates a significant portion of revenue from recurring service contracts, supported by a scalable technology platform and a large client base across the U.S. and parts of Europe.
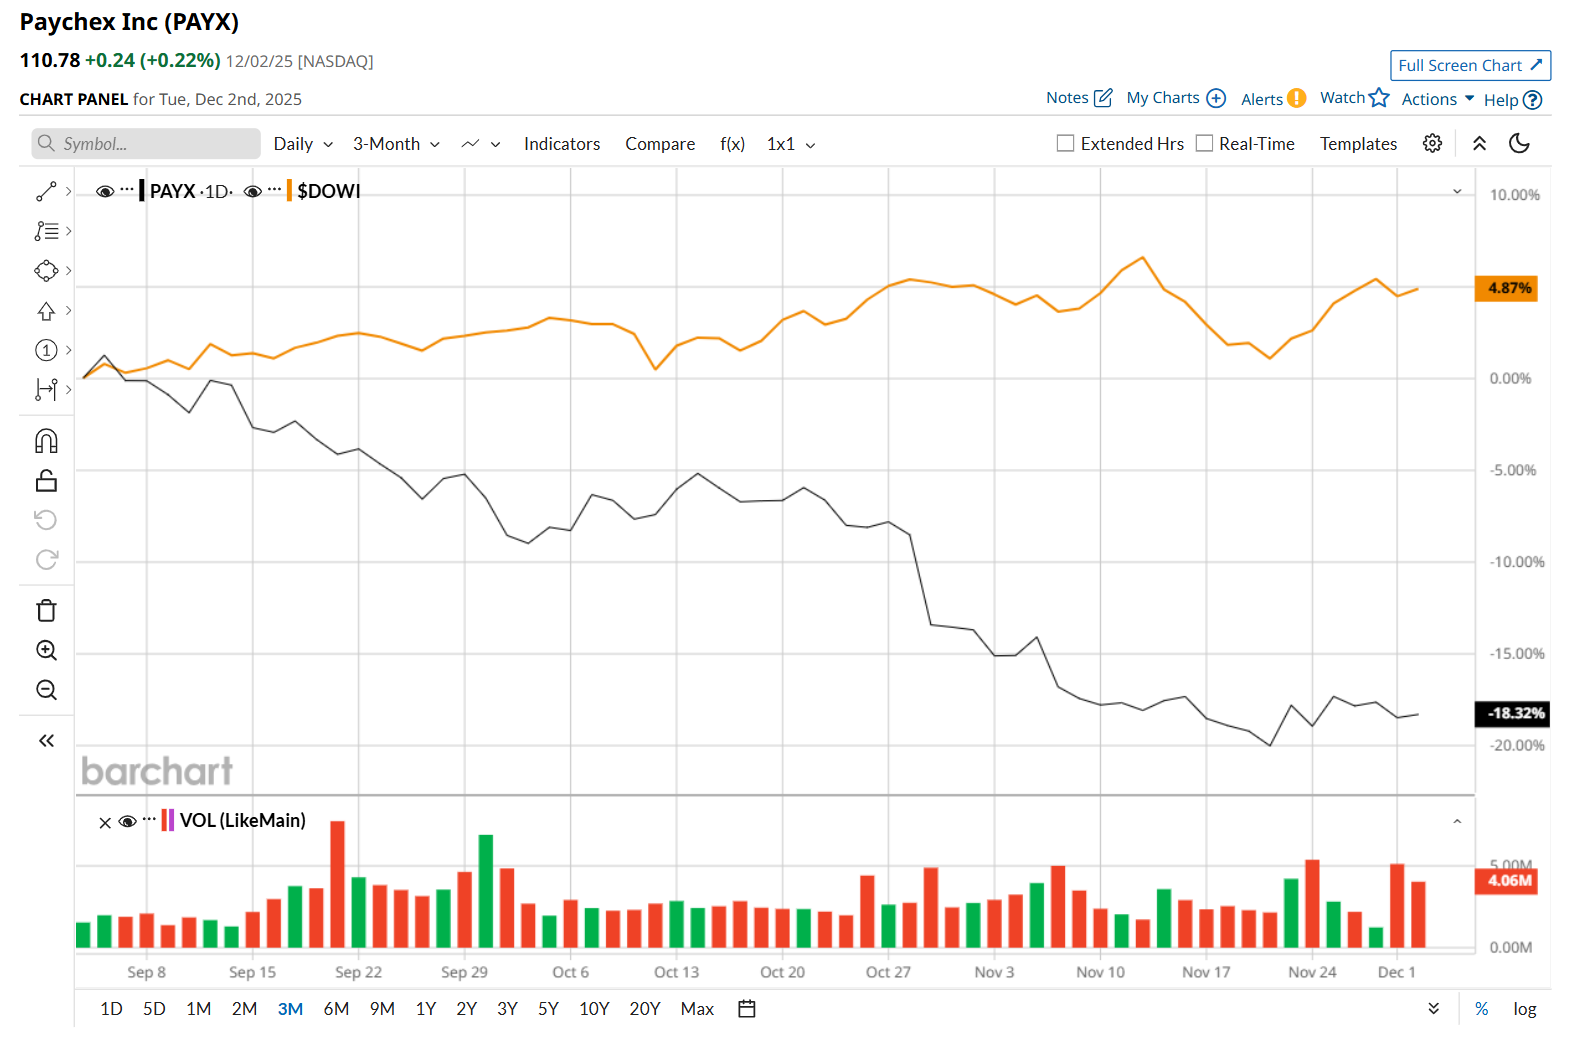
This HCM solutions provider has dipped 31.3% from its 52-week high of $161.24, reached on Jun. 6. Shares of PAYX have declined 18.5% over the past three months, considerably lagging behind the Dow Jones Industrial Average’s ($DOWI) 4.8% rise during the same time frame.
In the longer term, PAYX has fallen 23.8% over the past 52 weeks, notably underperforming DOWI's 6% uptick over the same time period. Moreover, on a YTD basis, shares of Paychex are down 21%, compared to DOWI’s 11.6% return.
To confirm its bearish trend, PAYX has been trading below its 200-day moving average since early July, with slight fluctuations, and has remained below its 50-day moving average since mid-June.

Shares of PAYX plunged 1.4% on Sep. 30 after its Q1 earnings release, despite reporting strong results. The company’s total revenue increased 16.8% year-over-year to $1.5 billion, meeting analyst estimates. Meanwhile, its adjusted EPS also grew 5.2% from the year-ago quarter to $1.22, exceeding consensus estimates by a penny. Furthermore, PAYX raised its fiscal 2026 adjusted EPS growth outlook in the range of 9% to 11%.
PAYX has also lagged behind its rival, Automatic Data Processing, Inc. (ADP), which declined 16% over the past 52 weeks and 12.1% on a YTD basis.
Looking at PAYX’s recent underperformance, analysts remain cautious about its prospects. The stock has a consensus rating of "Hold” from the 17 analysts covering it, and the mean price target of $135.28 suggests a 22.1% premium to its current price levels.
On the date of publication, Neharika Jain did not have (either directly or indirectly) positions in any of the securities mentioned in this article. All information and data in this article is solely for informational purposes. For more information please view the Barchart Disclosure Policy here.
More news from Barchart
- Dear AVGO Stock Fans, Mark Your Calendars for December 11
- Small-Cap Investment Firm Slumps to 52-Week Low: Opportunity or Red Flag?
- IonQ Wants to Bring Quantum Computing to Medicine. Should You Buy IONQ Stock Here?
- Jamie Dimon Once Called Bitcoin a ‘Fraud.’ Now, JPMorgan Is Quietly Making Blockchain History and Betting This ‘Crypto Winter’ Will Be Short-Lived.


