Ross Stores, Inc. (ROST), headquartered in Dublin, California, operates off-price retail apparel and home fashion stores under the Ross Dress for Less and dd's DISCOUNTS brand names. Valued at $57.8 billion by market cap, ROST offers designer apparel, accessories, footwear, and home fashions at discount prices.
Companies worth $10 billion or more are generally described as “large-cap stocks,” and ROST perfectly fits that description, with its market cap exceeding this mark, underscoring its size, influence, and dominance within the apparel retail industry. ROST is crushing it as a leading off-price retailer with 1,831 Ross and 355 dd's Discounts stores. Its strategy of offering 20% to 60% off brand-name merchandise attracts value-conscious shoppers and drives loyalty.
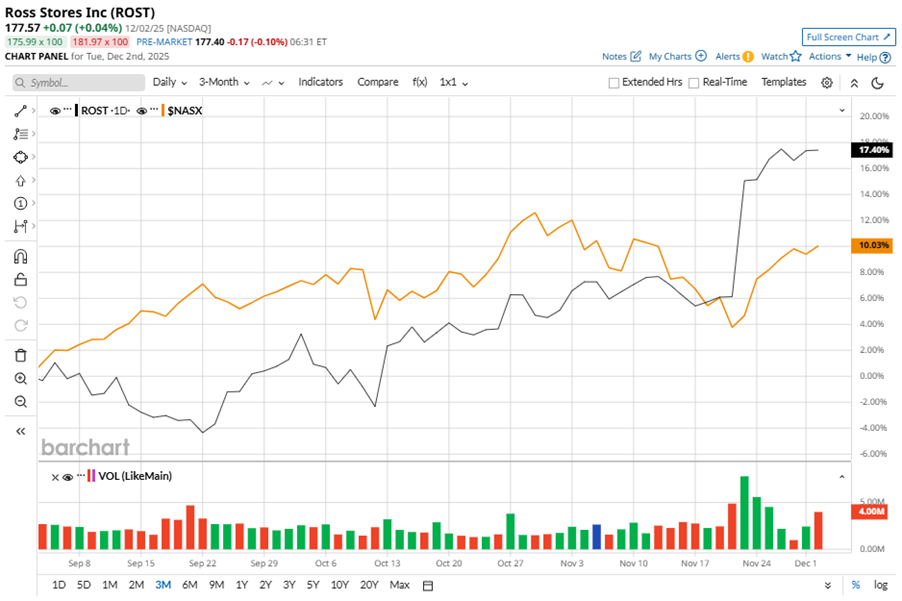
Despite its notable strength, ROST slipped marginally from its 52-week high of $178.80, achieved on Dec. 1. Over the past three months, ROST stock gained 17.4%, outperforming the Nasdaq Composite’s ($NASX) 10% gains during the same time frame.
In the longer term, shares of ROST rose 24.7% on a six-month basis, outperforming NASX’s six-month gains of 21.7%. However, the stock climbed 13.6% over the past 52 weeks, underperforming NASX’s 20.7% returns over the same time period.
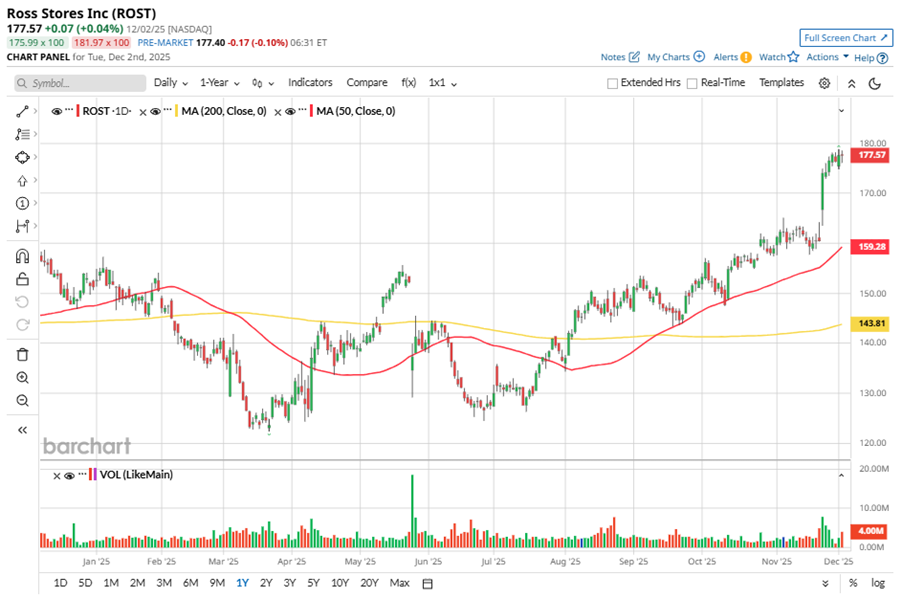
To confirm the bullish trend, ROST has been trading above its 50-day moving average since late July. The stock has been trading above its 200-day moving average since early August.
On Nov. 20, ROST reported its Q3 results, and its shares closed up more than 8% in the following trading session. Its EPS of $1.58 exceeded Wall Street expectations of $1.40. The company’s revenue was $5.6 billion, topping Wall Street forecasts of $5.4 billion. ROST expects full-year EPS to be $6.38 to $6.46.
In the competitive apparel retail space, The TJX Companies, Inc. (TJX) has taken the lead over ROST, showing resilience with an 18.9% uptick over the past 52 weeks, but trailing the stock's 16.8% six-month gains.
Wall Street analysts are reasonably bullish on ROST’s prospects. The stock has a consensus “Moderate Buy” rating from the 19 analysts covering it, and the mean price target of $182.33 suggests a potential upside of 2.7% from current price levels.
On the date of publication, Neha Panjwani did not have (either directly or indirectly) positions in any of the securities mentioned in this article. All information and data in this article is solely for informational purposes. For more information please view the Barchart Disclosure Policy here.
More news from Barchart
- Down 41% From Its Highs, Should You Buy the Dip in MP Materials Stock?
- How to Use the Naked Put Options Strategy to Earn Income & Buy Stocks at a Discount
- Dan Ives Says AI Bubble Fears Are ‘Overblown’ and He’s Betting on This 1 Data Center Stock Now
- S&P Futures Tick Higher With U.S. Economic Data in Focus