Based in Midland, Michigan, Dow Inc. (DOW) is a leading U.S.-based materials-science and chemical company that supplies plastics, resins, coatings, and specialty chemicals to industries such as packaging, construction, automotive, and consumer goods. With a market capitalization of $17 billion, it provides materials science solutions, spanning Packaging & Specialty Plastics, Industrial Intermediates & Infrastructure, and Performance Materials & Coatings.
Companies valued at $10 billion or more are typically classified as “large-cap stocks,” and DOW fits the label perfectly, with its market cap exceeding this threshold, underscoring its size, influence, and dominance within the materials sector. With a global footprint and diversified product portfolio, Dow focuses on materials innovation, performance, and sustainability, providing foundational solutions that underpin thousands of end-products worldwide.
Despite its substantial scale, Dow’s stock has continued to face considerable headwinds. Its shares currently trade roughly 46.1% below their 52-week high of $44.04. In the past three months, the stock has fallen marginally, while the S&P 500 Index ($SPX) 6.2% surge during the same time frame.
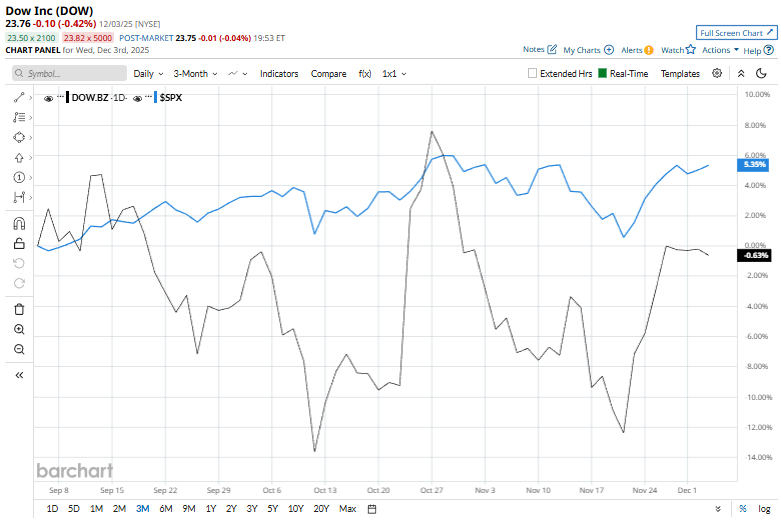
Looking over a broader horizon, Dow has dropped 45.8% over the past 52 weeks and has plunged 40.8% year to date. By comparison, $SPX has climbed 13.2% in the past year and 16.5% in 2025.
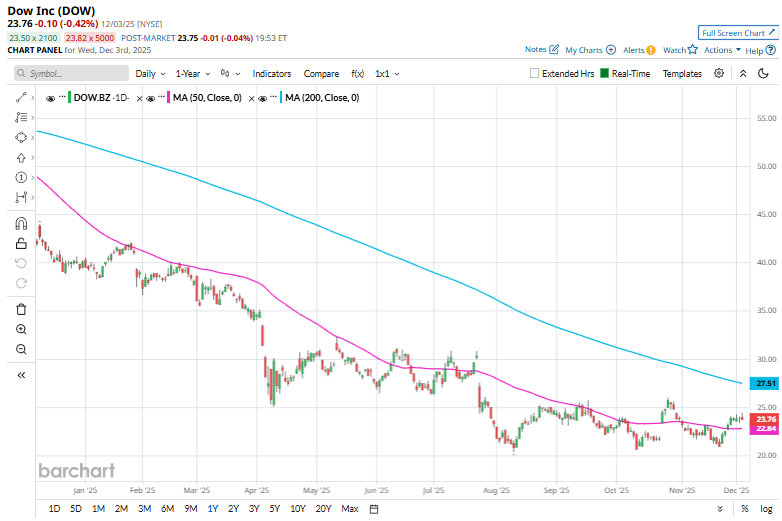
The stock has traded consistently below its 200-day moving average and has recently climbed over its 50-day moving average.
Dow’s stock surged nearly 13% on Oct. 23, after releasing third-quarter earnings despite the company missing revenue expectations with sales of $9.97 billion. The rally was driven by an adjusted loss of just $0.19 per share, far narrower than analysts anticipated, along with strong execution on cost-cutting initiatives. The company has already secured more than half of its targeted $6.5 billion in near-term cash support, including $1 billion in reduced capital spending and accelerated cost savings. Increased volumes from new polyethylene and alkoxylation facilities along the U.S. Gulf Coast also supported margin improvement.
However, relative to peers, Dow’s decline appears moderate. Its rival Celanese Corporation (CE) has fallen 42.3% over the past 52 weeks and 39.6% year-to-date.
The stock has received a consensus rating of “Hold” from the 20 analysts in coverage, with the mean price target of $27.11 reflecting a premium of 14.1% from current levels.
On the date of publication, Kritika Sarmah did not have (either directly or indirectly) positions in any of the securities mentioned in this article. All information and data in this article is solely for informational purposes. For more information please view the Barchart Disclosure Policy here.
More news from Barchart
- Grain Market Update: Where are Corn and Soybean Prices Headed?
- This High-Yield Utility Stock Is a Top AI Buy
- Is the Wheel the Best Options Strategy for Income? Here’s How to Trade Options Like Warren Buffett
- Ford Just Reported an Absolute Collapse in Its EV Sales. That Could Be a Key Warning for Tesla Stock.