Durham, North Carolina-based IQVIA Holdings Inc. (IQV) provides clinical research services, commercial insights, and healthcare intelligence to the life sciences industry. Valued at $38.4 billion by market cap, the company operates through Technology & Analytics (TAS), Research & Development (R&DS), and Contract Sales & Medical Solutions (CSMS) segments.
Companies worth $10 billion or more are generally described as "large-cap stocks." IQVIA fits right into that category, with its market cap exceeding this threshold, reflecting its substantial size, influence, and dominance in the diagnostics & research industry. The company’s operations span the Americas, Europe, Africa, and the Indo-Pacific.
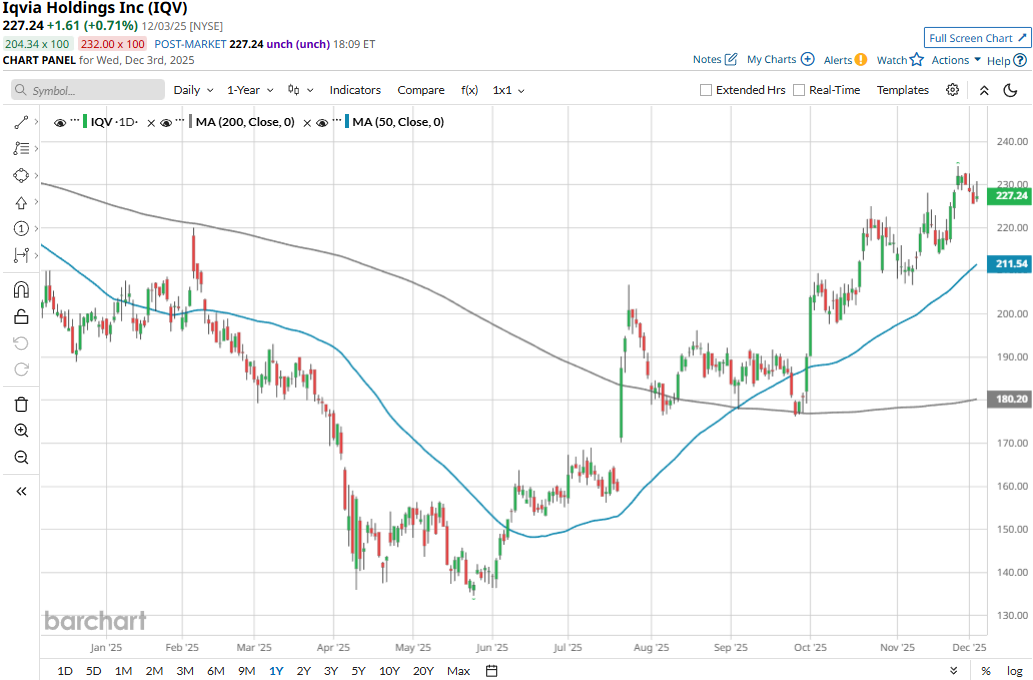
IQVIA touched its 52-week high of $234.29 on Nov. 25 and is currently trading 3% below that peak. Meanwhile, its stock prices have soared 23.1% over the past three months, outpacing the S&P 500 Index’s ($SPX) 6.2% gains during the same time frame.
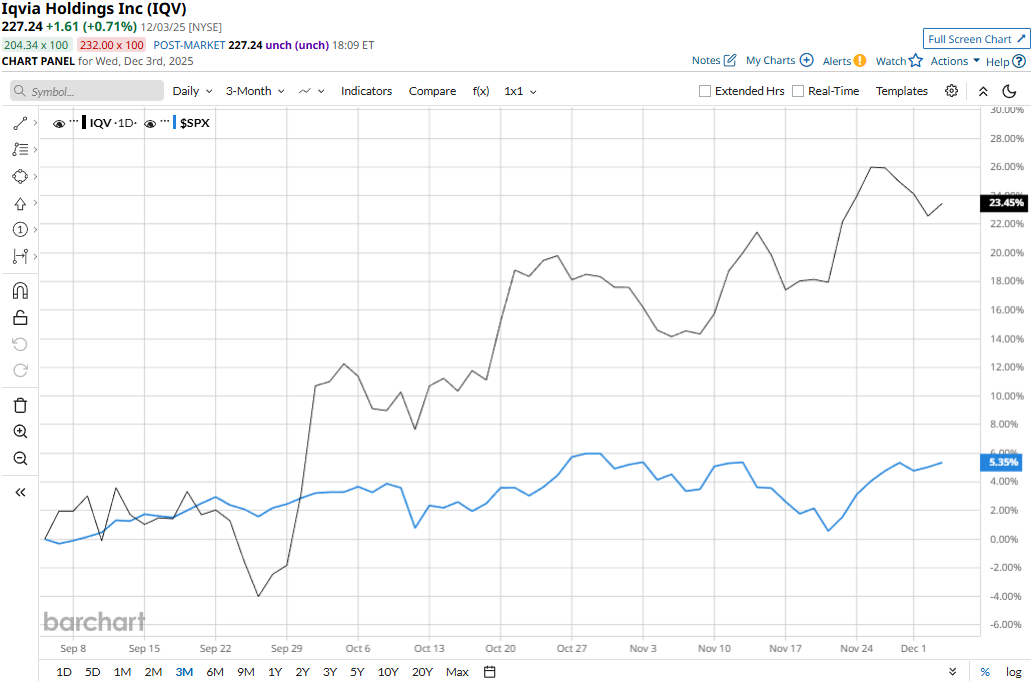
IQVIA has slightly lagged behind the broader market over the longer term. IQV stock prices have gained 15.6% on a YTD basis and 13% over the past 52 weeks, compared to the SPX’s 16.5% gains in 2025 and 13.2% returns over the past year.
IQV stock has traded mostly above its 50-day moving average since early June and above its 200-day moving average since late July, underscoring its bullish trend.
IQVIA’s stock prices observed a marginal uptick in the trading session following the release of its better-than-expected Q3 results on Oct. 28. The company registered a notable growth in organic revenues and also observed favourable currency movement. This led to a 5.2% year-over-year growth in topline to $4.1 billion, beating the Street’s expectations by 86 bps. Meanwhile, its adjusted EPS grew 5.6% year-over-year to $3.00, surpassing the consensus estimates by 1.4%.
Further, IQVIA has also outperformed its peer Agilent Technologies, Inc.’s (A) 11.1% gains on a YTD basis and 7.2% returns over the past year.
Among the 22 analysts covering the IQV stock, the consensus rating is a “Strong Buy.” Its mean price target of $244.10 suggests a 7.4% upside potential from current price levels.
On the date of publication, Aditya Sarawgi did not have (either directly or indirectly) positions in any of the securities mentioned in this article. All information and data in this article is solely for informational purposes. For more information please view the Barchart Disclosure Policy here.
More news from Barchart
- Grain Market Update: Where are Corn and Soybean Prices Headed?
- This High-Yield Utility Stock Is a Top AI Buy
- Is the Wheel the Best Options Strategy for Income? Here’s How to Trade Options Like Warren Buffett
- Ford Just Reported an Absolute Collapse in Its EV Sales. That Could Be a Key Warning for Tesla Stock.


