Houston, Texas-based LyondellBasell Industries N.V. (LYB) is a chemical company that manufactures polyethylene, polypropylene, advanced polymers, fuels, and other petrochemical products. Valued at a market cap of $15.4 billion, the company supplies materials that are essential to a wide range of end markets, including packaging, construction, automotive, healthcare, and consumer goods.
Companies worth $10 billion or more are typically classified as “large-cap stocks,” and LYB fits the label perfectly, with its market cap exceeding this threshold, underscoring its size, influence, and dominance within the specialty chemicals industry. With ongoing investments in recycling and circular plastics, the company is focused on sustainability and reducing environmental impact while maintaining strong cash flows through its diversified product portfolio and scale advantages.
This chemical company has dipped 42.5% from its 52-week high of $80, reached on Dec. 4, 2024. Shares of LYB have declined 15.1% over the past three months, considerably lagging behind the Nasdaq Composite’s ($NASX) 9.1% rise during the same time frame.
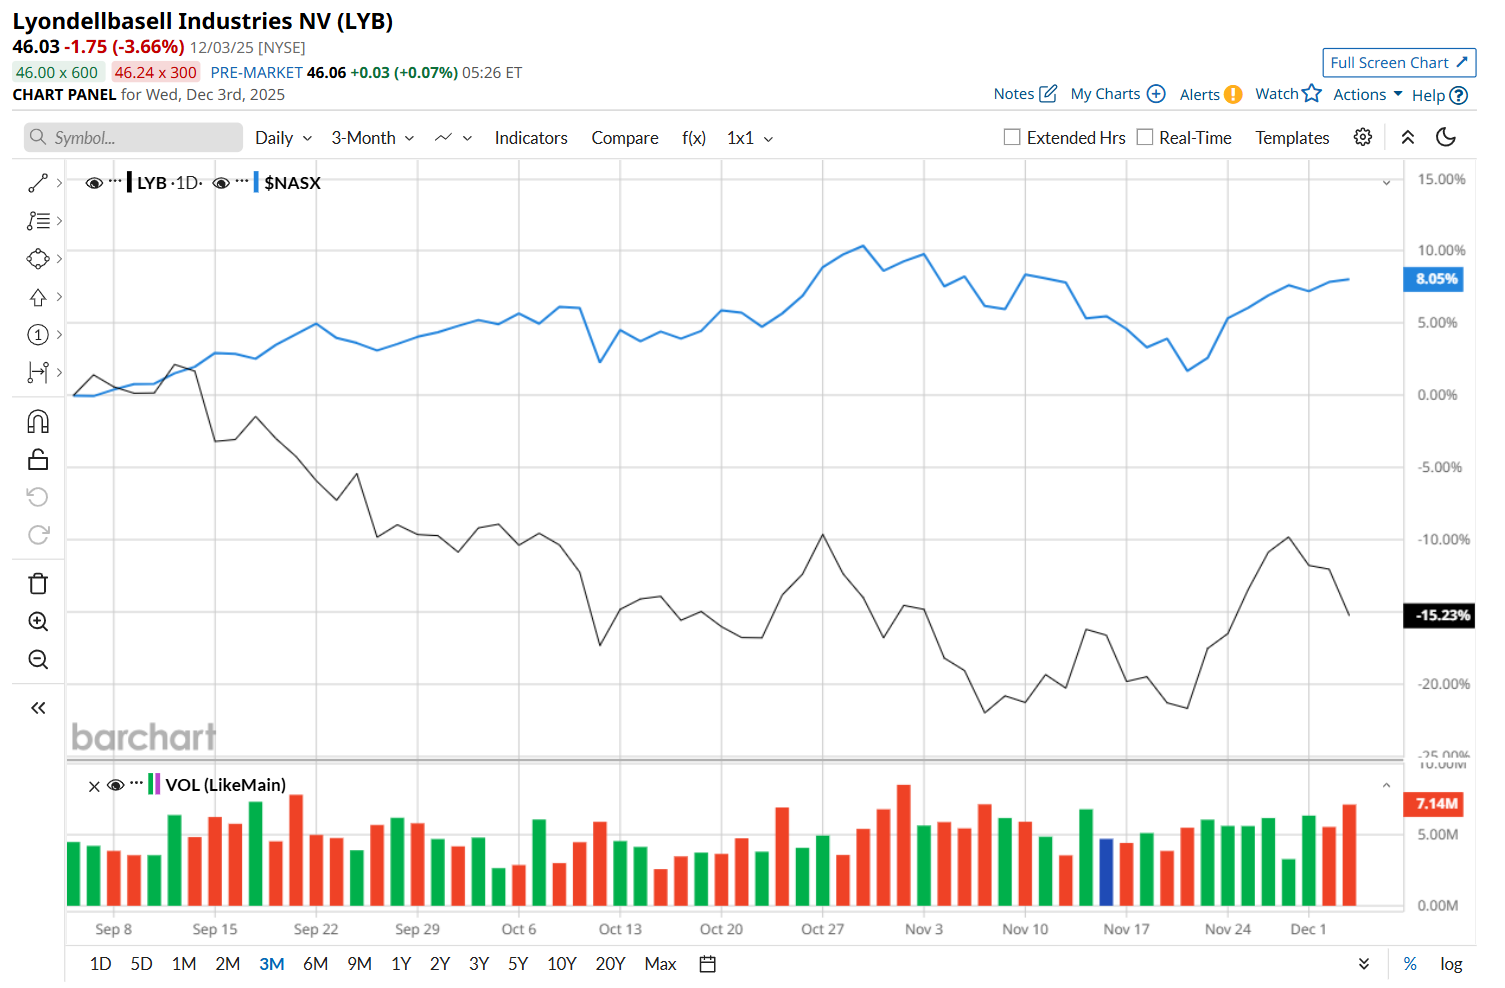
Moreover, on a YTD basis, shares of LYB are down 38%, compared to NASX’s 21.5% return. In the longer term, LYB has dropped 43% over the past 52 weeks, notably underperforming NASX’s 20.4% uptick over the same time frame.
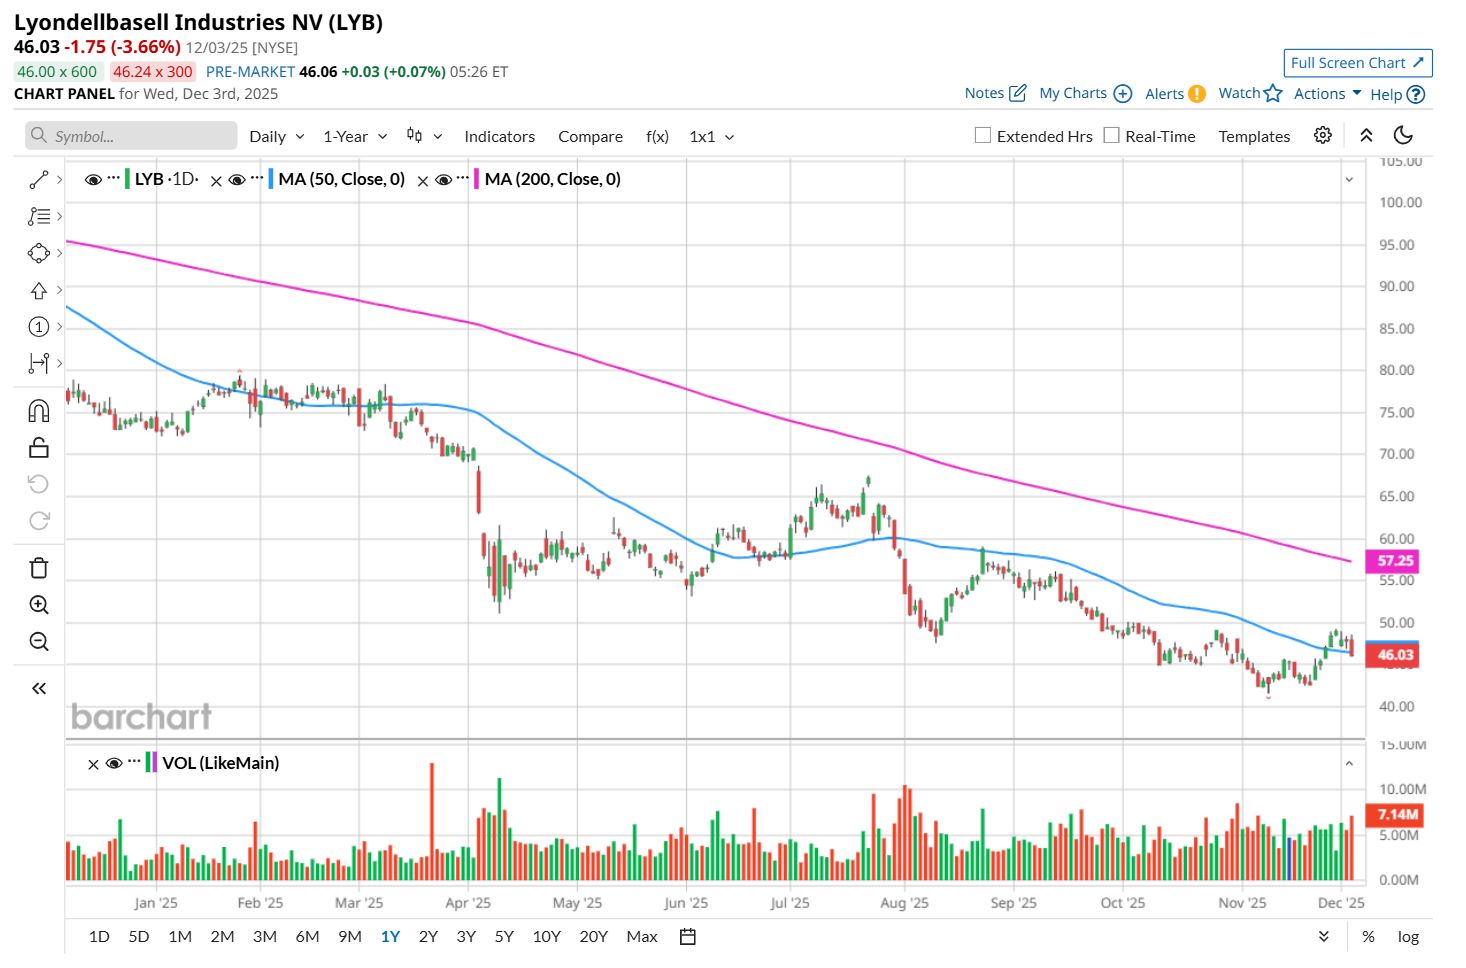
To confirm its bearish trend, LYB has been trading below its 200-day moving average over the past year and has remained below its 50-day moving average since late July, with minor fluctuations.
Shares of LYB surged 2.7% after its Q3 earnings release on Oct. 31. Due to a challenging market environment, the company’s overall revenue declined 10.2% year-over-year to $7.7 billion. Meanwhile, its adjusted EPS also decreased 47.1% from the year-ago quarter to $1.01, but exceeded consensus estimates by a notable margin of 26.3%. Furthermore, LYB highlighted that its cash Improvement plan is on track to achieve its $600 million target in 2025 and a minimum of $1.1 billion by the end of 2026, by reducing fixed costs, managing working capital and optimizing capital investment.
LYB’s underperformance looks even more pronounced when compared to its rival, DuPont de Nemours, Inc. (DD), which soared 14.3% over the past 52 weeks and 24.3% on a YTD basis.
Given LYB’s recent underperformance, analysts remain cautious about its prospects. The stock has a consensus rating of "Hold” from the 21 analysts covering it, and the mean price target of $54.20 suggests a 17.7% premium to its current price levels.
On the date of publication, Neharika Jain did not have (either directly or indirectly) positions in any of the securities mentioned in this article. All information and data in this article is solely for informational purposes. For more information please view the Barchart Disclosure Policy here.
More news from Barchart


