Valued at $32.4 billion by market cap, Nucor Corporation (NUE) is the largest steel producer and recycler in the U.S., based in Charlotte, North Carolina. It operates across steel mills, steel products, and raw materials, producing everything from sheet and structural steel to finished products like joists, girders, and tubing. Nucor’s scrap-based, electric-arc furnace model makes it more flexible and environmentally conscious than traditional steelmakers.
Companies worth $10 billion or more are generally described as “large-cap stocks,” and NUE perfectly fits that description, with its market cap exceeding this mark, underscoring its size, influence, and dominance within the steel industry. With integrated operations and a diversified product portfolio, it serves construction, infrastructure, manufacturing, and energy sectors, positioning itself as a resilient and efficient leader in the steel industry.
Despite its notable strength, NUE touched its 52-week high of $166.26 in the last trading session. Over the past three months, NUE stock has gained 13.4%, outperforming the Nasdaq Composite’s ($NASX) 9.1% rise during the same time frame.
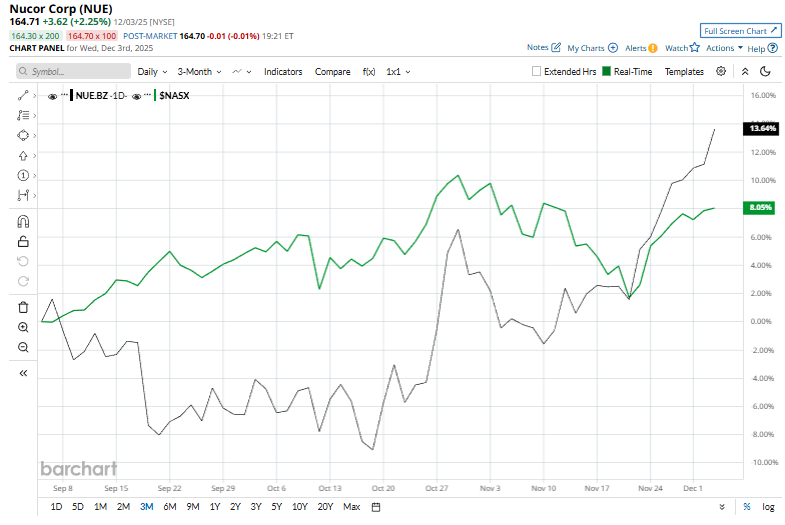
In the longer term, shares of NUE rose 41.1% on a YTD basis, outperforming NASX’s YTD gains of 21.5%. However, the stock climbed 6.3% over the past 52 weeks, underperforming $NASX’s solid 20.5% returns over the last year.
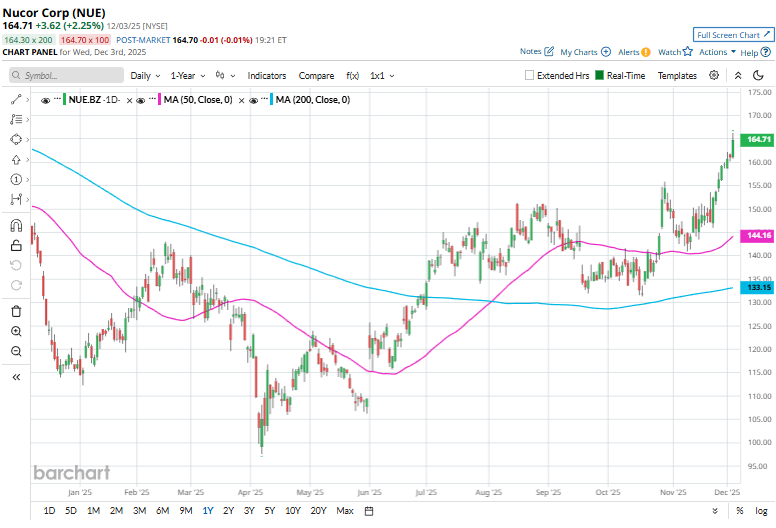
To confirm the bullish trend, NUE has been trading above its 200-day moving average since early July. Moreover, it has been trading over the 50-day moving average since late October.
Nucor delivered its third-quarter earnings on Oct. 27, and its shares surged 3.9% reporting revenue of $8.52 billion and EPS of $2.63, both well above year-ago levels and analyst expectations. The Steel Mills segment drove the gains with higher shipments and robust margins, while Steel Products and Raw Materials saw sequential dips due to higher costs and softer pricing. The company maintained a strong balance sheet with $2.22 billion in cash, an undrawn credit facility, and continued shareholder returns through dividends and share buybacks.
NUE’s rival, Steel Dynamics, Inc. (STLD) shares have taken the lead over Nucor, with a 50.4% uptick on a YTD basis and 19.8% gains over the past 52 weeks.
Wall Street analysts are bullish on NUE’s prospects. The stock has a consensus “Strong Buy” rating from the 14 analysts covering it, and the stock currently trades above the mean price target of $169.17.
On the date of publication, Kritika Sarmah did not have (either directly or indirectly) positions in any of the securities mentioned in this article. All information and data in this article is solely for informational purposes. For more information please view the Barchart Disclosure Policy here.
More news from Barchart
- Grain Market Update: Where are Corn and Soybean Prices Headed?
- This High-Yield Utility Stock Is a Top AI Buy
- Is the Wheel the Best Options Strategy for Income? Here’s How to Trade Options Like Warren Buffett
- Ford Just Reported an Absolute Collapse in Its EV Sales. That Could Be a Key Warning for Tesla Stock.