Schaffhausen, Switzerland-based Garmin Ltd. (GRMN) is a technology company that designs and manufactures GPS-enabled devices and smart wearables for fitness, outdoor recreation, aviation, marine, and automotive markets. Valued at a market cap of $38.9 billion, the company’s product portfolio includes smartwatches, fitness trackers, cycling computers, handheld GPS devices, avionics systems, navigation solutions, and sonar and chartplotter technologies for boating.
Companies valued at $10 billion or more are typically classified as “large-cap stocks,” and Garmin fits the label perfectly, with its market cap exceeding this threshold, underscoring its size, influence, and dominance within the scientific & technical instruments industry. The company differentiates itself through purpose-built, high-precision products tailored to specific activities and professional applications rather than general consumer electronics. With a focus on long battery life, durability, and feature-rich performance, GRMN has built strong brand loyalty across athletes, outdoor enthusiasts, pilots, and marine professionals.
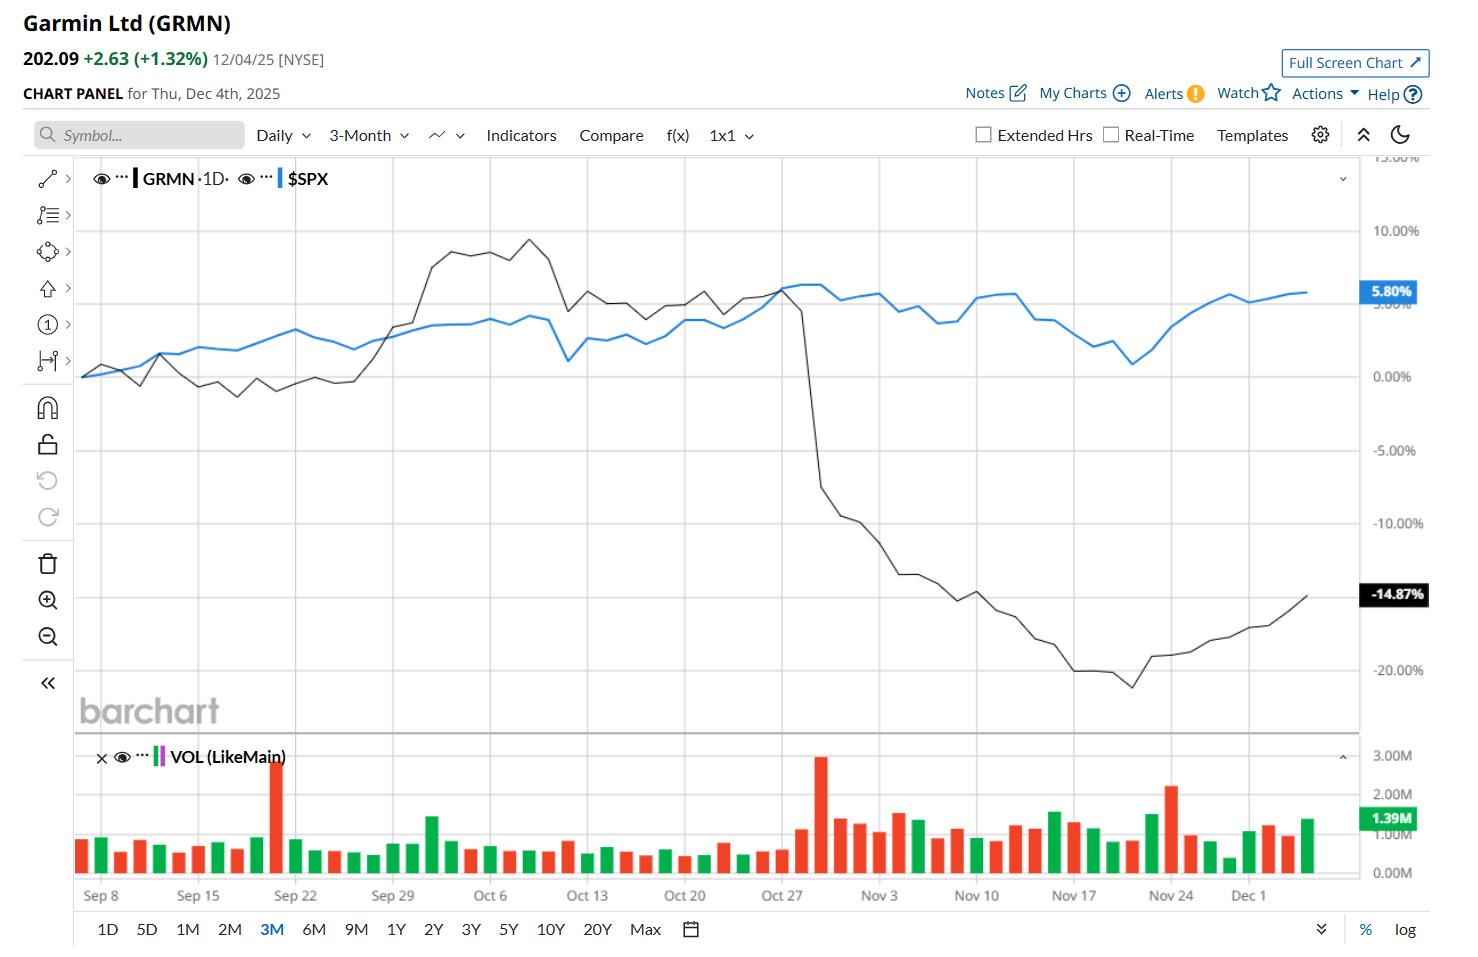
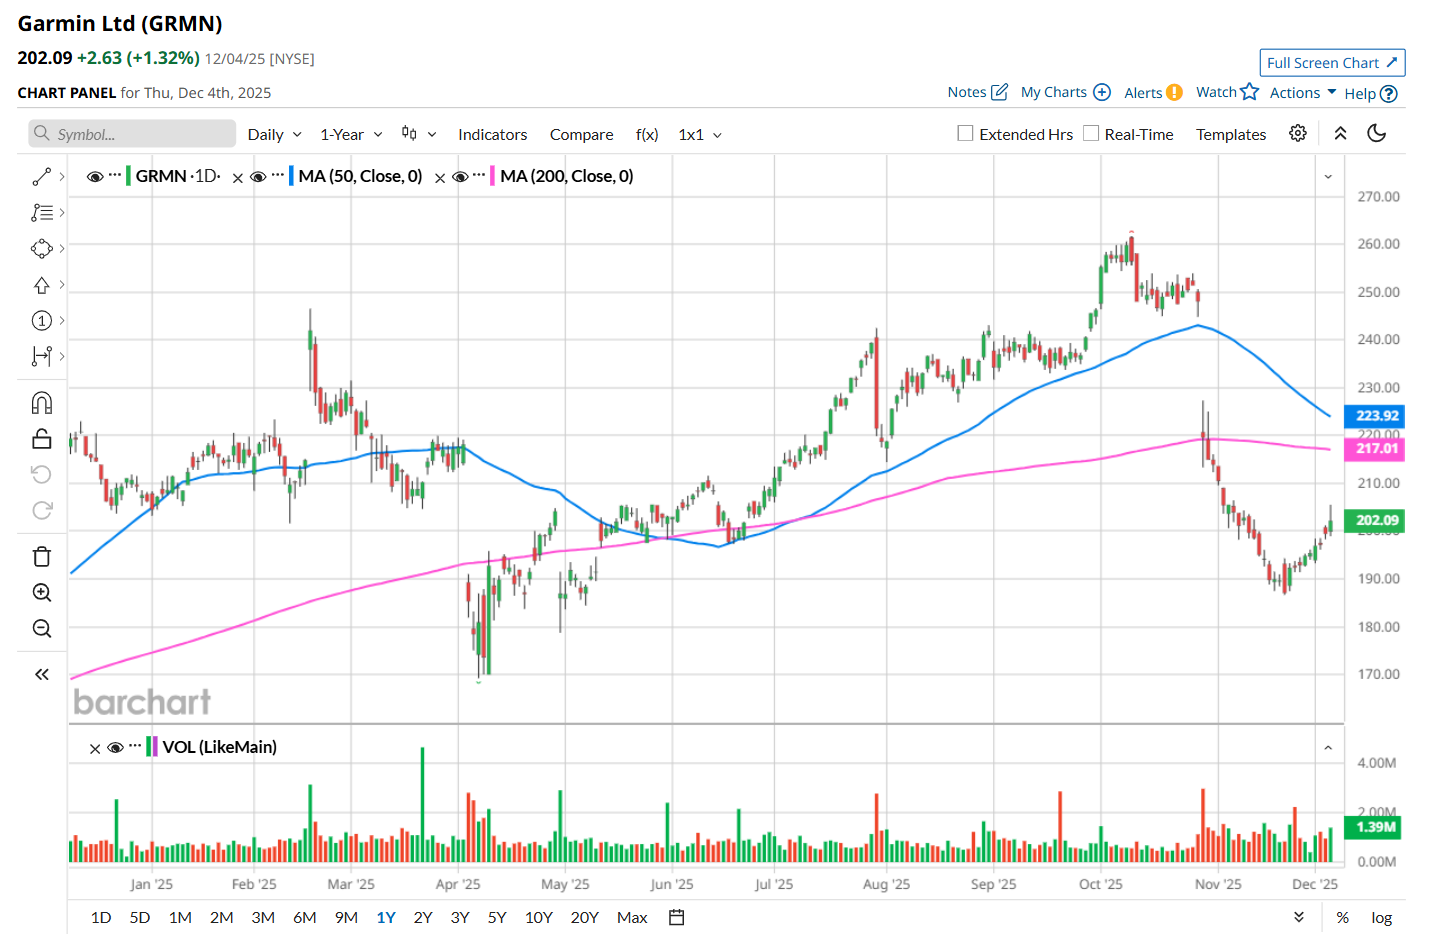
This tech company has slipped 22.8% from its 52-week high of $261.69, reached on Oct. 9. Shares of Garmin have declined 15% over the past three months, considerably underperforming the S&P 500 Index’s ($SPX) 5.5% rise during the same time frame.
In the longer term, GRMN has dropped 6.3% over the past 52 weeks, lagging behind SPX’s 12.7% uptick over the same time frame. Moreover, on a YTD basis, shares of Garmin are down 2%, compared to SPX’s 16.6% return.
To confirm its bearish trend, GRMN has been trading below its 200-day and 50-day moving averages since late October.
On Oct. 29, shares of Garmin plunged 11.5% after its mixed Q3 earnings release. The company’s adjusted EPS of $1.99 remained flat year-over-year, but topped analyst estimates by a penny. However, on the other hand, its overall revenue grew 11.7% from the year-ago quarter to $1.8 billion, but missed consensus estimates by 1.1%, which might have made investors jittery. A fall in its outdoor and auto OEM segments' sales likely contributed to its topline miss.
GRMN has also underperformed its rival, Trimble Inc. (TRMB), which gained 9.3% over the past 52 weeks and 16.5% on a YTD basis.
Given GRMN’s recent underperformance, analysts remain cautious about its prospects. The stock has a consensus rating of "Hold” from the eight analysts covering it, and the mean price target of $232.17 suggests a 14.9% premium to its current price levels.
On the date of publication, Neharika Jain did not have (either directly or indirectly) positions in any of the securities mentioned in this article. All information and data in this article is solely for informational purposes. For more information please view the Barchart Disclosure Policy here.
More news from Barchart


