Valued at a market cap of $22 billion, ON Semiconductor Corporation (ON) provides intelligent sensing and power solutions. The Scottsdale, Arizona-based company provides power management chips, silicon carbide (SiC) solutions, image sensors, and other high-performance semiconductors used in electric vehicles, advanced driver-assistance systems (ADAS), renewable energy, factory automation, and data-center applications.
Companies worth $10 billion or more are typically classified as “large-cap stocks,” and ON fits the label perfectly, with its market cap exceeding this threshold, underscoring its size, influence, and dominance within the semiconductor industry. Strong design-win momentum, long-term supply agreements, and investment in silicon carbide manufacturing continue to support the company’s role as a key enabler of sustainable, energy-efficient technologies.
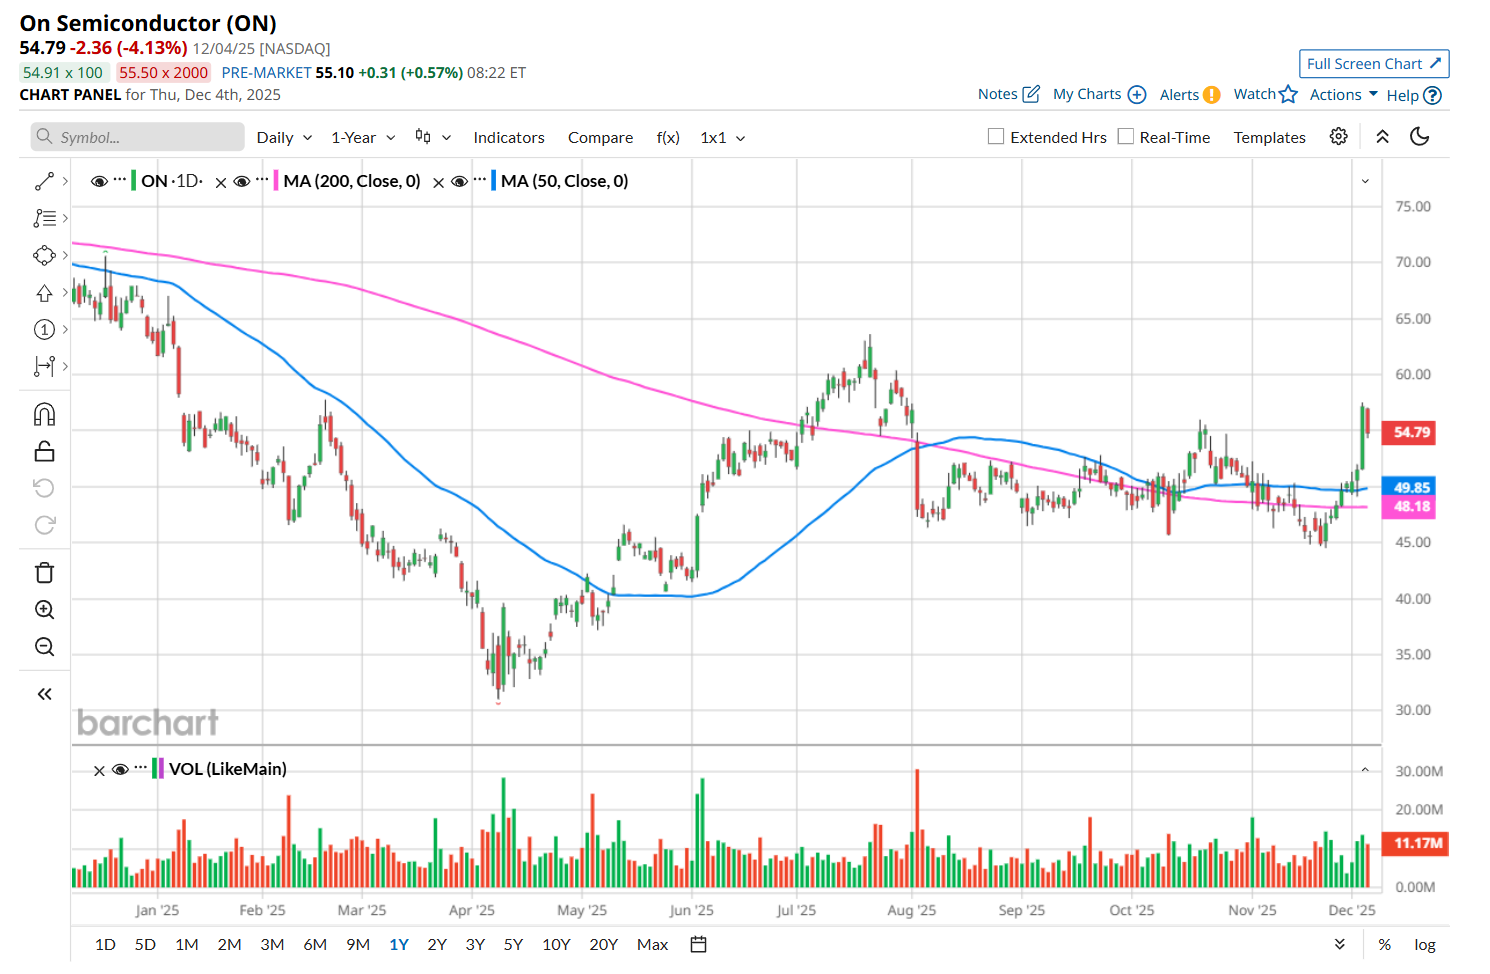
This tech company is currently trading 22.4% below its 52-week high of $70.58, reached on Dec. 17, 2024. Shares of ON have gained 14% over the past three months, outperforming the Nasdaq Composite’s ($NASX) 8.3% rise during the same time frame.
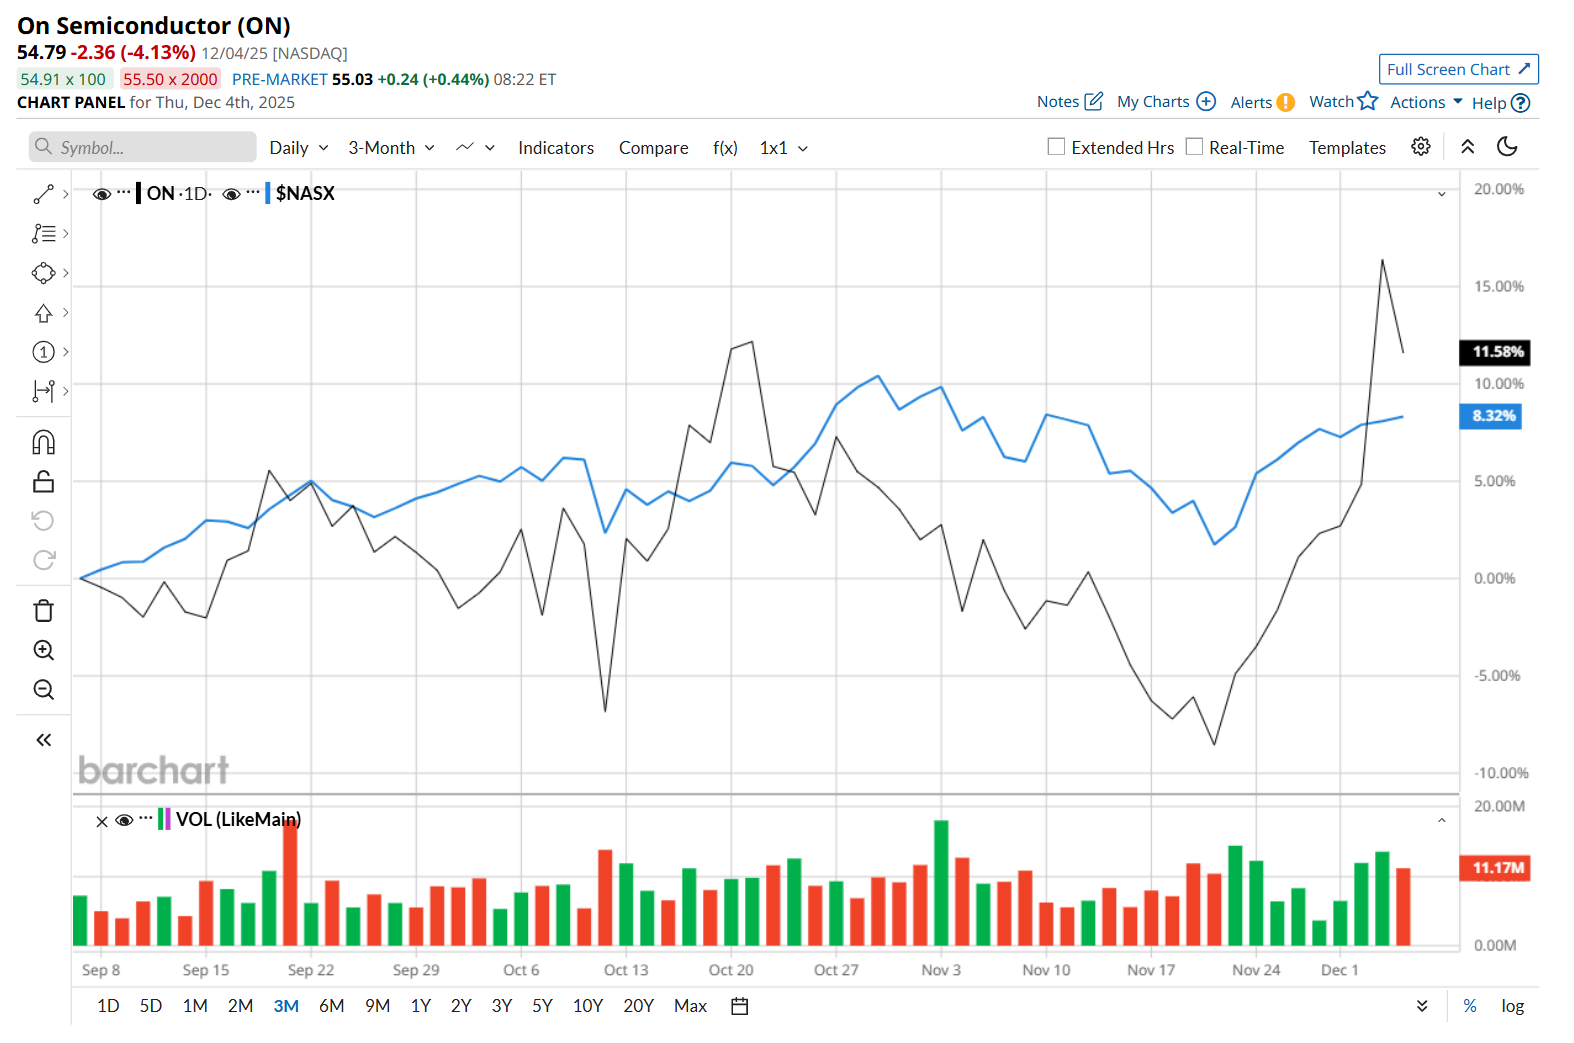
However, on a YTD basis, shares of ON are down 13.1%, trailing behind NASX’s 21.7% return. Moreover, in the longer term, ON has declined 17% over the past 52 weeks, considerably lagging behind NASX’s 19.1% uptick over the same time frame.
To confirm its recent bullish trend, ON has been trading above its 200-day and 50-day moving averages since late November.
On Nov. 3, shares of ON closed up marginally after its better-than-expected Q3 earnings release. The company’s revenue declined 12% year-over-year to $1.6 billion, but topped analyst expectations by 2%. Moreover, its adjusted EPS of $0.63 also fell 36.4% from the year-ago quarter and surpassed consensus estimates of $0.60.
ON has also considerably underperformed its rival, STMicroelectronics N.V. (STM), which gained 1.7% over the past 52 weeks and 5.7% on a YTD basis.
Looking at ON’s recent outperformance, analysts remain moderately optimistic about its prospects. The stock has a consensus rating of "Moderate Buy” from the 33 analysts covering it, and the mean price target of $58.78 suggests a 7.3% premium to its current price levels.
On the date of publication, Neharika Jain did not have (either directly or indirectly) positions in any of the securities mentioned in this article. All information and data in this article is solely for informational purposes. For more information please view the Barchart Disclosure Policy here.
More news from Barchart
- Apple Made a Comeback with the iPhone 17, But Will Executive Exits Pull Down AAPL Stock?
- This Former Penny Stock Just Doubled for the Second Time This Week. Should You Chase the Rally Here?
- 3 High-Yield Stocks to Invest in Oracle’s AI Growth with Less Volatility
- iPhone Revenue Just Jumped 40%. Should You Buy AAPL Stock Here?


