ETFOptimize | High-performance ETF-based Investment Strategies

Quantitative strategies, Wall Street-caliber research, and insightful market analysis since 1998.


ETFOptimize | HOME
Close Window

Is Masco Stock Underperforming the S&P 500?

ⓘ This article is third-party content and does not represent the views of this site. We make no guarantees regarding its accuracy or completeness.

With a market cap of $12.2 billion, Masco Corporation (MAS) is a global manufacturer of home improvement and building products, serving customers across North America, Europe, and other international markets. The company operates through two main segments: Plumbing Products, which includes a wide range of faucets, showers, plumbing systems, and spa-related products, and Decorative Architectural Products, which offers paints, coatings, and hardware solutions. 

Companies valued at $10 billion or more are generally considered “large-cap” stocks, and Masco fits this criterion perfectly, exceeding the mark. Masco distributes its products through major retailers, wholesalers, contractors, and online channels under numerous well-known brands.


Shares of the building products & equipment manufacturer have pulled back 24.3% from its 52-week high of $79.19MAS stock is down 8% over the past three months, underperforming the broader S&P 500 Index's ($SPX) 3.1% drop in the same period.

www.barchart.com

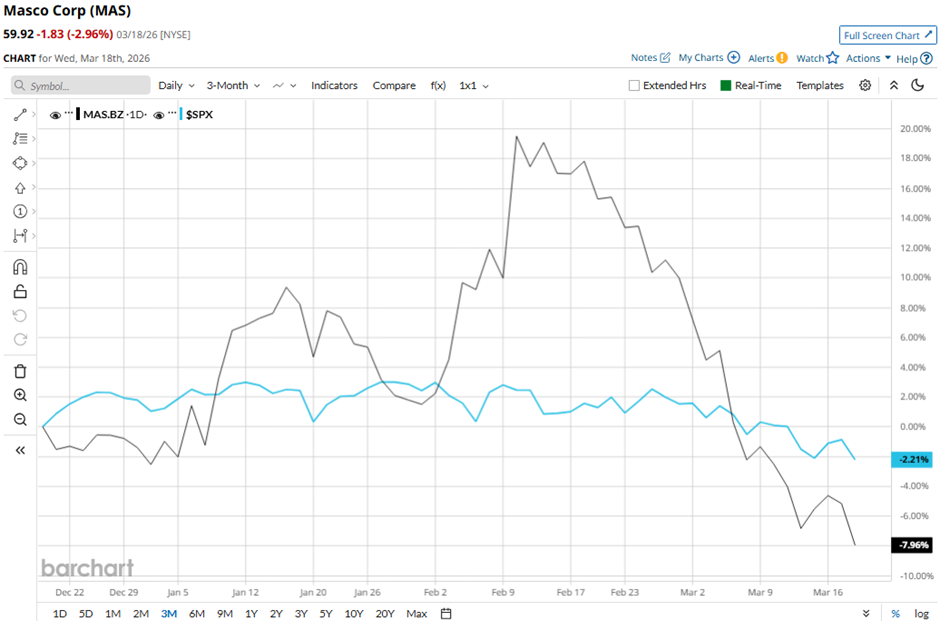
Shares of the Livonia, Michigan-based company have declined 5.6% on a YTD basis, lagging behind SPX's 3.2% decrease. Moreover, MAS stock has dipped 15.2% over the past 52 weeks, compared to SPX's 16.7% return.

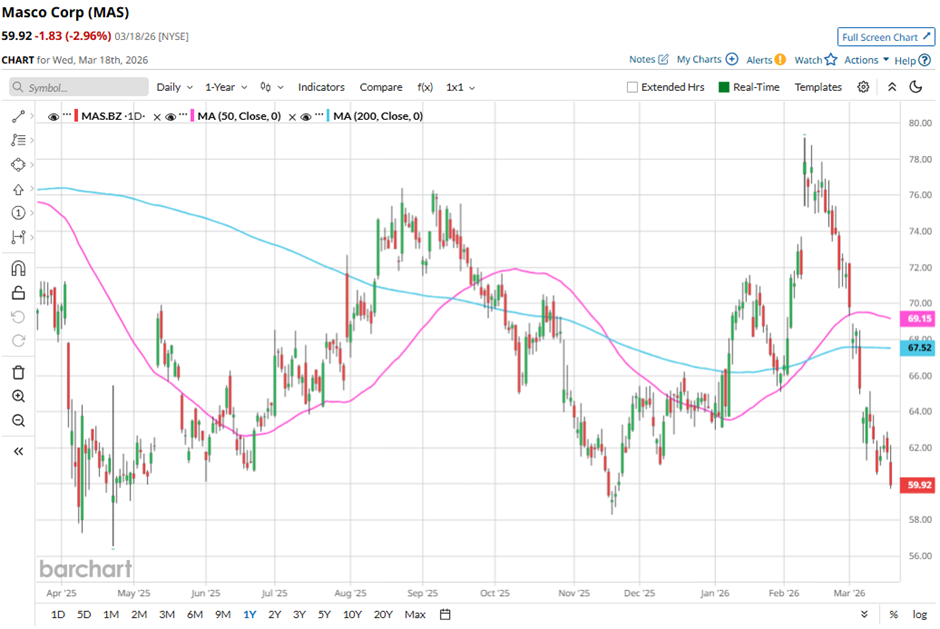
Starting this year, the stock has been trading above its 50-day and 200-day moving averages. However, it has fallen below its 50-day and 200-day moving averages since March.

www.barchart.com

Over the past year, Masco Corporation has underperformed due to weak DIY paint demand from a sluggish housing market, lower volumes, and margin pressure from higher tariffs and commodity costs. 

In Q4 2025, the company reported mixed results, with net income declining to $165 million, revenue falling to $1.79 billion (missing estimates), Decorative Architectural sales dropping 15%, and operating margin compressing to 13.8%. Yet shares climbed 8.7% as adjusted EPS of $0.82 beat expectations, Plumbing Products grew 5%, and a $2 billion new buyback was announced.

Investor sentiment was further supported by restructuring actions (including job cuts), cost optimization efforts, and a solid 2026 adjusted EPS outlook of $4.10 - $4.30.

In comparison, rival Advanced Drainage Systems, Inc. (WMS) has lagged behind MAS stock on a YTD basis, with WMS stock falling 6.5%. Nevertheless, WMS stock has gained 23.2% over the past 52 weeks, outpacing MAS stock. 

Despite the stock’s weak performance relative to SPX, analysts are moderately optimistic about its prospects. MAS stock has a consensus rating of “Moderate Buy” from the 23 analysts covering it, and the mean price target of $80.44 suggests a premium of 34.2% to current levels.


On the date of publication, Sohini Mondal did not have (either directly or indirectly) positions in any of the securities mentioned in this article. All information and data in this article is solely for informational purposes. For more information please view the Barchart Disclosure Policy here.


More news from Barchart

Report this content

If you believe this article contains misleading, harmful, or spam content, please let us know.

Report this article

Recent Quotes

View More
Symbol Price Change (%)
AMZN  263.04
+3.34 (1.29%)
AAPL  270.17
-0.54 (-0.20%)
AMD  337.11
+13.90 (4.30%)
BAC  52.88
+0.22 (0.42%)
GOOG  347.31
-0.19 (-0.05%)
META  669.12
-2.22 (-0.33%)
MSFT  424.46
-4.79 (-1.12%)
NVDA  209.25
-3.92 (-1.84%)
ORCL  163.83
-2.13 (-1.28%)
TSLA  372.80
-3.22 (-0.86%)
Stock Quote API & Stock News API supplied by www.cloudquote.io
Quotes delayed at least 20 minutes.
By accessing this page, you agree to the Privacy Policy and Terms Of Service.


IntelligentValue Home
Close Window

DISCLAIMER

All content herein is issued solely for informational purposes and is not to be construed as an offer to sell or the solicitation of an offer to buy, nor should it be interpreted as a recommendation to buy, hold or sell (short or otherwise) any security.  All opinions, analyses, and information included herein are based on sources believed to be reliable, but no representation or warranty of any kind, expressed or implied, is made including but not limited to any representation or warranty concerning accuracy, completeness, correctness, timeliness or appropriateness. We undertake no obligation to update such opinions, analysis or information. You should independently verify all information contained on this website. Some information is based on analysis of past performance or hypothetical performance results, which have inherent limitations. We make no representation that any particular equity or strategy will or is likely to achieve profits or losses similar to those shown. Shareholders, employees, writers, contractors, and affiliates associated with ETFOptimize.com may have ownership positions in the securities that are mentioned. If you are not sure if ETFs, algorithmic investing, or a particular investment is right for you, you are urged to consult with a Registered Investment Advisor (RIA). Neither this website nor anyone associated with producing its content are Registered Investment Advisors, and no attempt is made herein to substitute for personalized, professional investment advice. Neither ETFOptimize.com, Global Alpha Investments, Inc., nor its employees, service providers, associates, or affiliates are responsible for any investment losses you may incur as a result of using the information provided herein. Remember that past investment returns may not be indicative of future returns.

Copyright © 1998-2017 ETFOptimize.com, a publication of Optimized Investments, Inc. All rights reserved.