Merrillville, Indiana-based NiSource Inc. (NI) is an energy holding company that operates as a regulated natural gas and electric utility company. Valued at $22.3 billion by market cap, the company provides natural gas to approximately 2.4 million residential, commercial, and industrial customers, and also generates, transmits, and distributes electricity to approximately 0.5 million customers in various counties in the northern part of Indiana.
Companies worth $10 billion or more are generally described as “large-cap stocks,” and NI perfectly fits that description, with its market cap exceeding this mark, underscoring its size, influence, and dominance within the utilities - regulated gas industry. NI operates within a strong regulatory framework, providing stable revenue from its regulated utilities serving millions of customers. The company's focus on safety and infrastructure investment, as evidenced by its Safety Management System (SMS) and ISO 55001 certification, underscores its commitment to operational excellence and customer safety.
Despite its notable strength, NI slipped 2.6% from its 52-week high of $47.96, achieved on Mar. 16. Over the past three months, NI stock has gained 14%, outperforming the Nasdaq Composite’s ($NASX) 5.2% losses during the same time frame.
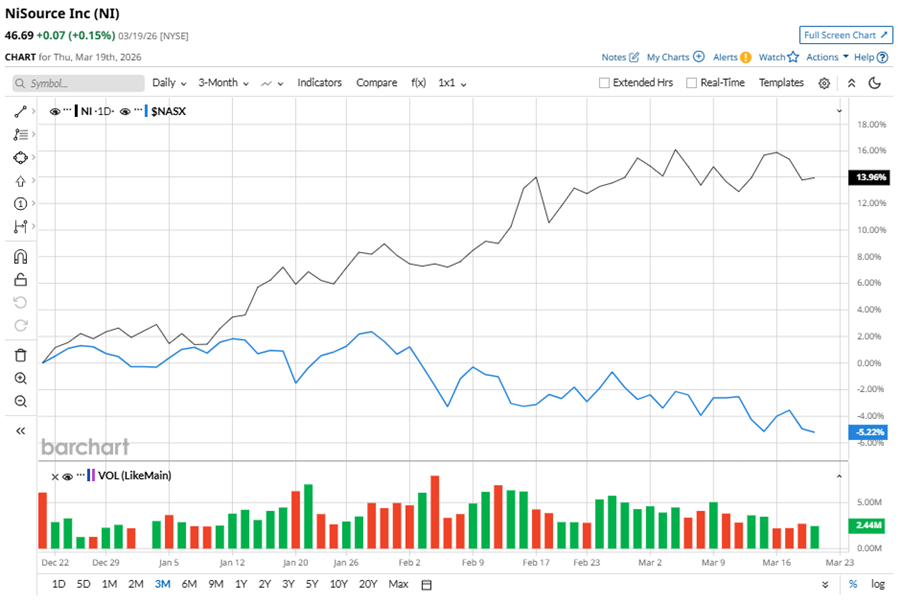
Shares of NI rose 15.8% on a six-month basis, outperforming NASX’s six-month 2.4% dip. However, in the longer term, the stock climbed 18.9% over the past 52 weeks, underperforming NASX’s 24.5% returns over the last year.
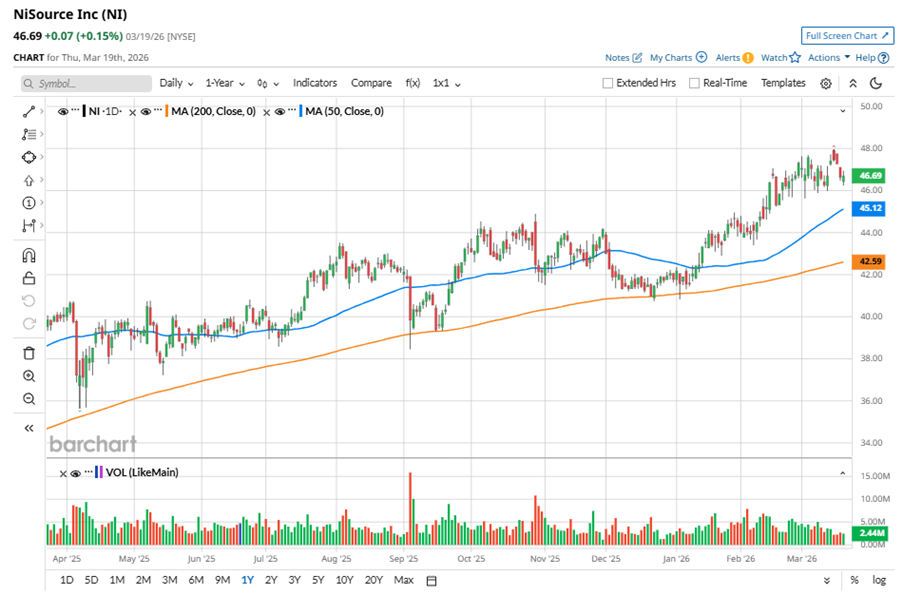
To confirm the bullish trend, NI has been trading above its 50-day moving average since mid-January. The stock is trading above its 200-day moving average over the past year, with slight fluctuations.
On Feb. 11, NI shares closed down marginally after reporting its Q4 results. Its adjusted EPS of $0.51 surpassed Wall Street expectations of $0.49. NI expects full-year adjusted EPS in the range of $2.02 to $2.07.
In the competitive arena of utilities - regulated gas, Atmos Energy Corporation (ATO) has taken the lead over NI, showing resilience with 22.7% gains over the past 52 weeks, but lagged behind the stock with a 13.5% uptick on a six-month basis.
Wall Street analysts are bullish on NI’s prospects. The stock has a consensus “Strong Buy” rating from the 15 analysts covering it, and the mean price target of $48.57 suggests a potential upside of 4% from current price levels.
On the date of publication, Neha Panjwani did not have (either directly or indirectly) positions in any of the securities mentioned in this article. All information and data in this article is solely for informational purposes. For more information please view the Barchart Disclosure Policy here.
More news from Barchart
- Cheniere Energy Stock Enters Overbought Territory on Strait of Hormuz Rally. Is It Too Late to Buy LNG Here?
- Is U.S. Natural Gas Entering a New Era?
- Goldman Sachs: Every $10 Jump in Oil Could Add 0.3% to U.S. Inflation
- Goldman Sachs Just Issued a New Warning on the U.S. Economy — And It’s Not Just About Oil