Valued at $6.2 billion by market cap, The Campbell's Company (CPB) is a leading packaged food manufacturer specializing in branded convenience foods, snacks, and meals. Headquartered in Camden, New Jersey, the company has evolved from its legacy identity as a soup maker into a broader center-of-the-store food powerhouse.
Companies worth between $2 billion and $10 billion are generally described as “mid-cap stocks,” and CPB perfectly fits that description, with its market cap exceeding this mark. Campbell’s has transitioned from a traditional soup company into a diversified packaged foods player, with snacks now acting as its primary growth engine.
Despite its notable strength, CPB slipped 48.1% from its 52-week high of $40.59. Over the past three months, CPB stock declined 26.3%, trailing the State Street Consumer Staples Select Sector SPDR Fund’s (XLP) 3.2% rise over the same time frame.
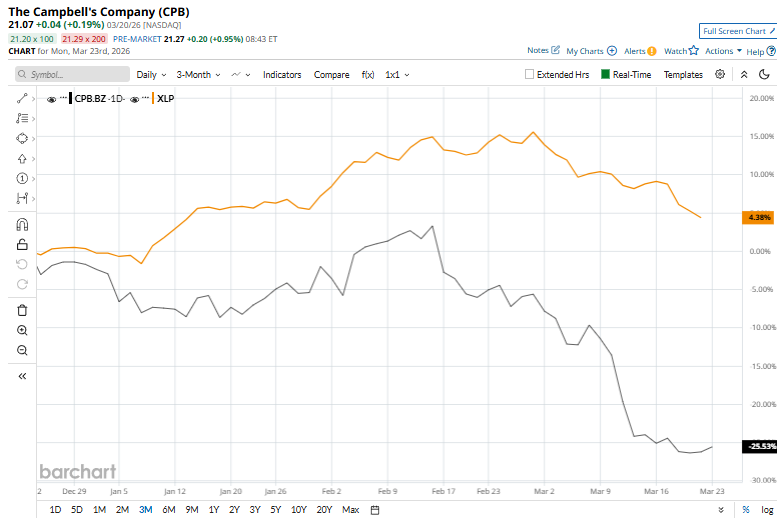
Zooming out, shares of CPB dipped 37% on a six-month basis and have fallen 44.5% over the past 52 weeks, significantly underperforming XLP’s six-month and annual gains of 2.4%.
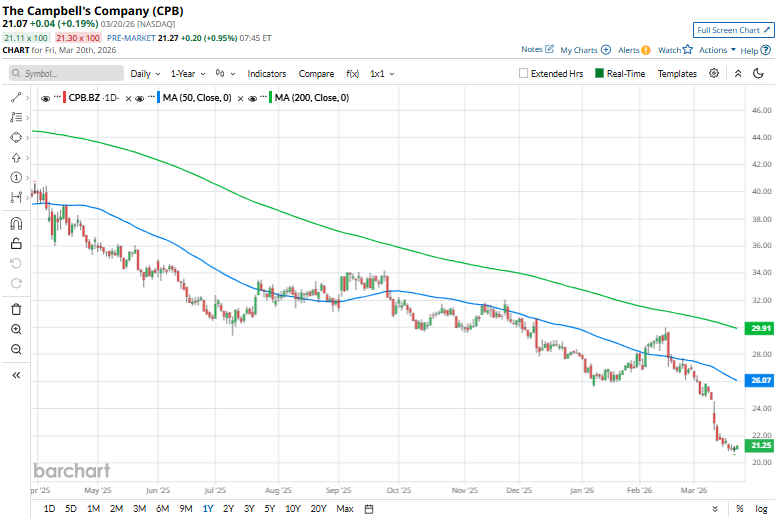
To confirm the bearish trend, CPB has been trading below its 50-day and 200-day moving averages over the past year, despite some fluctuations.
The Campbell's Company reported a disappointing FY2026 Q2 on March 11, with net sales declining 5% year over year to $2.56 billion and adjusted EPS falling 31% to $0.51, both missing expectations. The primary drag came from weak Snacks segment volumes and unfavorable mix, compounded by input cost inflation, tariffs, and supply chain pressures, which drove margin compression. As a result, its shares tanked 7.1% following the announcement.
CPB’s rival, General Mills, Inc. (GIS), has faced similar challenges, with 26.5% losses on a six-month basis, and 36.5% downtick over the past 52 weeks.
Wall Street analysts are cautious on CPB’s prospects. The stock has a consensus “Hold” rating from the 19 analysts covering it, and the mean price target of $24.18 suggests a potential upside of 14.8% from current price levels.
On the date of publication, Kritika Sarmah did not have (either directly or indirectly) positions in any of the securities mentioned in this article. All information and data in this article is solely for informational purposes. For more information please view the Barchart Disclosure Policy here.
More news from Barchart
- As the Market Gives Us Lemons, This Nvidia Collar Might Just Taste Like Lemonade
- The Super Micro Computer Co-Founder Faces New Chip Smuggling Charges. Does That Actually Matter for SMCI Stock?
- A Plunge in Aluminum Futures Sends Alcoa Stock Below Its 50-Day Moving Average. Should You Buy the Dip?
- As Lawmakers Zero in on Nvidia-Groq Deal, Should You Be Worried About NVDA Stock?


