 Warehouse clubs have been the darling of Wall Street this year as consumers flock to find bargains during uncertain economic times. This has been evidenced by the strong performance in names like Costco Wholesale (NASDAQ: COST), Walmart (NYSE: WMT), small box warehouse retailer Dollar General (NYSE: DG), and Five Below (NASDAQ: FIVE). Weaker consumer spending from high inflation has been the theme this year, so it would make sense that consumers are looking for better ways to stretch their budgets. However, Big Lots (NYSE: BIG) is not showing many benefits from cheap customers as their business continues to decline. Does this mean that warehouse clubs and big box stores are all hurting alike? Not quite. Big Lots is a home products discount retailer. With the exception of cleaning products and non-perishable snacks, most of its items are non-essential items like furnishings, toys, and apparel. Big Lots is closer to a Bed Bath & Beyond (NASDAQ: BBBY) than Costco, especially as it pertains to mounting losses and short interest at 27.66% compared to 30% short interest for Bed Bath & Beyond. Shares hit a post-pandemic high of $73.23 in January 2021 during the housing boom but have collapsed to recent lows of around $15.16 as waning consumer discretionary spend, high inflation and high inventory levels take hold.
Losses Continue to Mount
On Dec. 1, 2022, Big Lots released its fiscal third-quarter 2022 results for the quarter ending Oct 2022. The Company reported an earnings-per-share (EPS) loss of (-$2.99) excluding non-recurring items versus consensus analyst estimates for a loss of (-$2.94), a (-$0.05) miss. Revenues fell (-9.8%) year-over-year (YoY) to $1.20 billion, missing consensus analyst estimates for $1.21 billion. The Company ended the quarter with $1.35 billion in cash and cash equivalents. Big Lots CEO Bruce Thorn commented, "The third quarter marks another quarter in which we met the challenges of a tough environment head on and did what we said we would do. Our sales and gross margin were in line with guidance and, importantly, year-over-year inventories continued to come down materially. We saw favorability in SG&A, as we tightly managed costs, and have strengthened our balance sheet and liquidity position."
Murky Guidance
The Company didn’t provide specific Q4 2022 EPS guidance but expects comps to be down in lower double-digit range. Net new stores will add 170 basis points of growth over 2021. They expect gross margin to improve sequentially over Q3 2022 but remain in mid 30s range, which includes additional markdowns related to accelerated store closures.
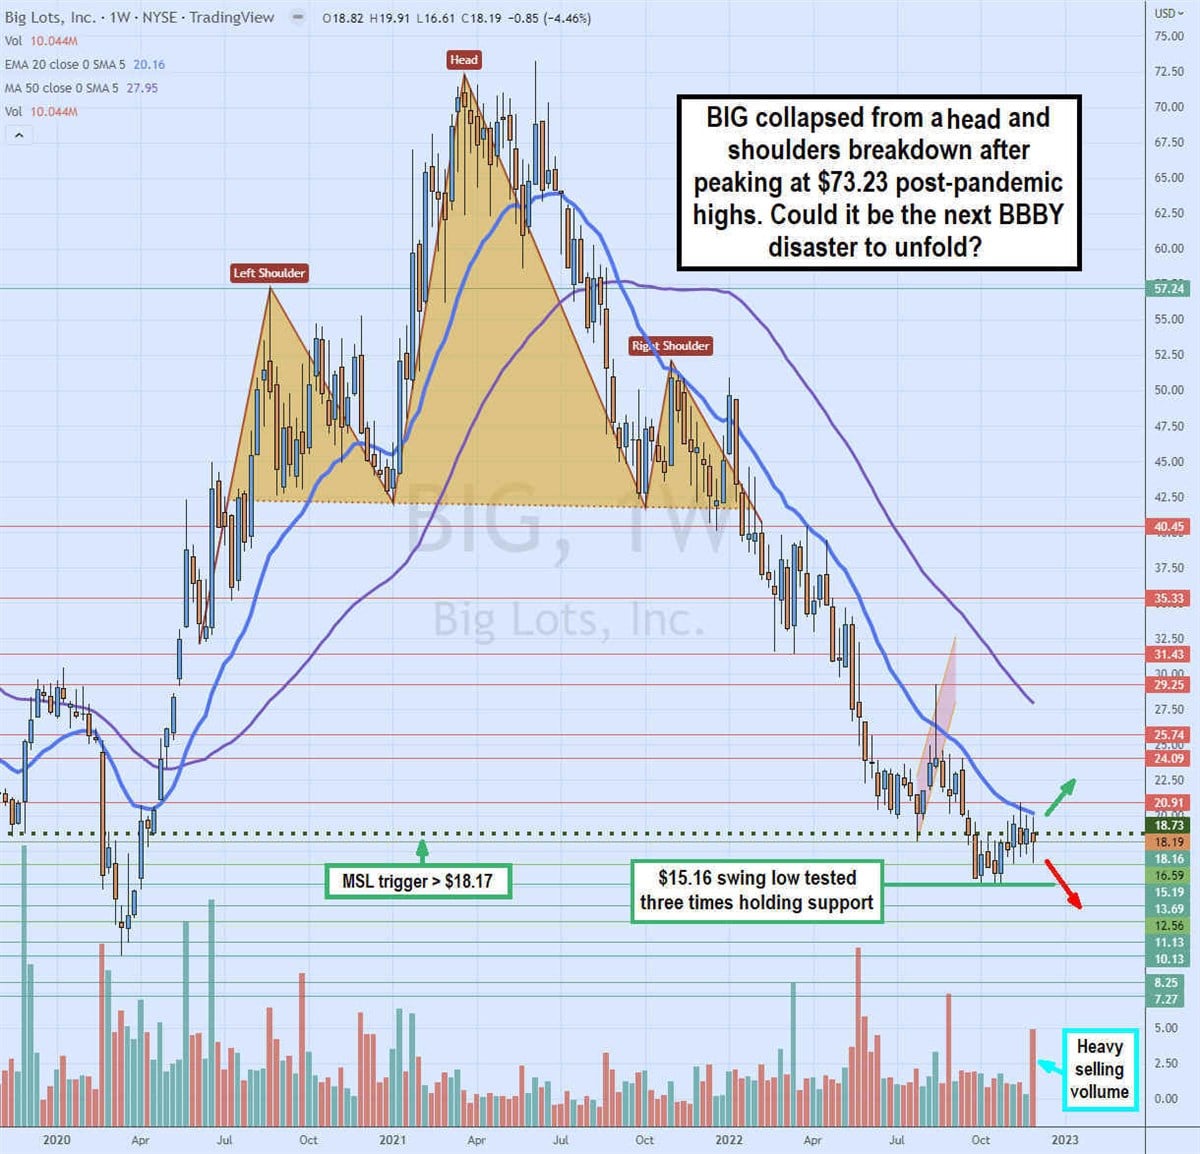
Head and Shoulders Followed by a Bear Flag
The weekly candlestick chart on BIG has been very bearish since its post-pandemic peak to form a giant head and shoulder (HNS) pattern. The neckline breakdown triggered on a collapse below $41.67 in January 2022. Shares have continued to slide rejecting every bounce attempt at the falling weekly 20-period exponential moving average (EMA) resistance. The falling weekly 50-period MA hasn’t even been touched. After a bear flag was triggered after peaking at $29.25 on Q2 2022 earnings, shares fell to a swing low of $15.16 in October 2022. This level has tested three times already and held support prompting a rally that once again that peaked off the falling 20-period EMA now trading at $20.16. The weekly 50-period MA sit at $27.95. The weekly market structure low (MSL) trigger sits at $18.19. Investors will need a Santa Claus rally to fuel a breakout through the weekly 20-period EMA to keep this one from dying on the vine.
Similarities and Differences to Bed Bath & Beyond
While Big Lots and Bed Bath & Beyond are both home furnishings stores, losing money and having high short interest levels in their respective stocks, there are differences between them. Big Lots still has cash at its ready of over $1.5 billion, still pays a dividend, and is working on clearing its slow-moving inventory. Bed Bad & Beyond had a different kind of inventory problem. Rumors are swirling that they couldn’t maintain inventory, not due to supply chain issues but because they still owed money to suppliers. Suppliers would no longer extend their credit until they were paid up. This apparently was the reason their shelves were 40% empty heading into Black Friday. Bed Bath & Beyond is desperately trying to raise cash and reduce debt by issuing more common stock and diluting shareholders. Bed Bath & Beyond has announced it closure of 150 stores and a (-20%) workforce reduction in a restructuring plan attempting to cut costs and strengthen its financial condition. Big Lots is not (yet) in Bed Bath & Beyond’s situation, but the future at least for the next quarter doesn’t look much better as the Company opted to forego its EPS forecast.


