 Online styling and apparel retailer platform Stitch Fix (NASDAQ: SFIX) shares have been a disaster falling (-72%) on the year. The online personal styling service was hurt during the COVID-19 lockdowns despite the migration to e-commerce as consumers flocked to athleisure and comfort wear at home. The spread of vaccinations accelerated the reopenings as consumer once again engaged at the office and social settings. The reopening was supposed to be a recovery for Stitch Fix on the heels of the return to the office trend, but it turns out that consumers also opted to return to brick-and-mortar stores.
 This hurt Stich Fix again as indicated by the (-5%) drop in active shoppers and (-8%) revenue drop in fiscal Q3 2022 platform prompting lowered forward guidance for the year. Margins have gotten squeezed as inflationary pressures mount on raw materials and logistics costs rise. This is especially painful when the Company offers free shipping and free returns. Stitch Fix is undergoing transformation to its Fix plus Freestyle ecosystem, which utilizes artificial intelligence (AI) to source outfits on the fly to enable immediate purchases versus the Fix only system that sends out a package selected by stylists to try at home (and return postage-free if not satisfied). The Freestyle Fix enables 10% greater margins and involves less shipping costs and returns and new pieces are refreshed daily in the customer’s personalized store. The Company is still the market leader in the fashion subscription market with over a 60% market share. Speculative investors looking for a cheap entry into the fashion subscription segment can watch for opportunistic pullbacks in shares of Stitch Fix.
Fiscal Q3 2022 Earnings Release
On June 9, 2021, Stich Fix released its fiscal third-quarter 2022 results for the quarter ending April 2021. The Company reported earnings-per-share (EPS) loss of (-$0.72) excluding non-recurring items versus consensus analyst estimates for a loss of (-$0.58), a (-$0.17) per share beat. Revenues fell (-8%) year-over-year (YoY) to $492.9 million, falling short of consensus estimates for $493.71 million. Active clients fell (-5%) to 3,907,000, down 200,000. Net revenue per active client (RPAC) rose 15% to $553. Stitch Fix CEO Elizabeth Spaulding commented, “While third quarter top-line results, as well as active client counts, were largely within our expectations, we know we still have work to do. This quarter we made progress on improving the overall client experience in order to position Stitch Fix for profitable growth and value creation over time. We are encouraged by the activity we are seeing inside the expanded Stitch Fix ecosystem, including our sixth consecutive quarter of revenue per active client growth.”
In-Line Guidance
Stich Fix issued in-line guidance for fiscal Q4 2022 revenues of $485 million to $495 million versus $492.24 million. The Company expects adjusted EBITDA of (-$30 million) to (-$25 million).
Conference Call Takeaways
CEO Spaulding explained the current transition to the Fix plus Freestyle ecosystem which opens up a total addressable market (TAM) that is 2X to 3X larger than current Fix only business. Freestyle has proven to have strong unit economics boosting margins. It has to be expanded as a customer acquisition vehicle. The transformation is not linear and will take some time. Apple’s privacy changes are impacting traffic to its sites making new client acquisitions challenging. RPAC has had its sixth consecutive quarter of growth. Freestyle revenue growth rose 13% YoY in special occasions and social wear. Freestyle sales for dresses grew 75% YoY. Nearly 20% of first time Freestyle customers tend to return and purchase again within 30 days. Freestyle fix will be the growth driver moving forward and the transformation of the ecosystem in include it is a top priority.
SFIX Opportunistic Pullback Price Levels
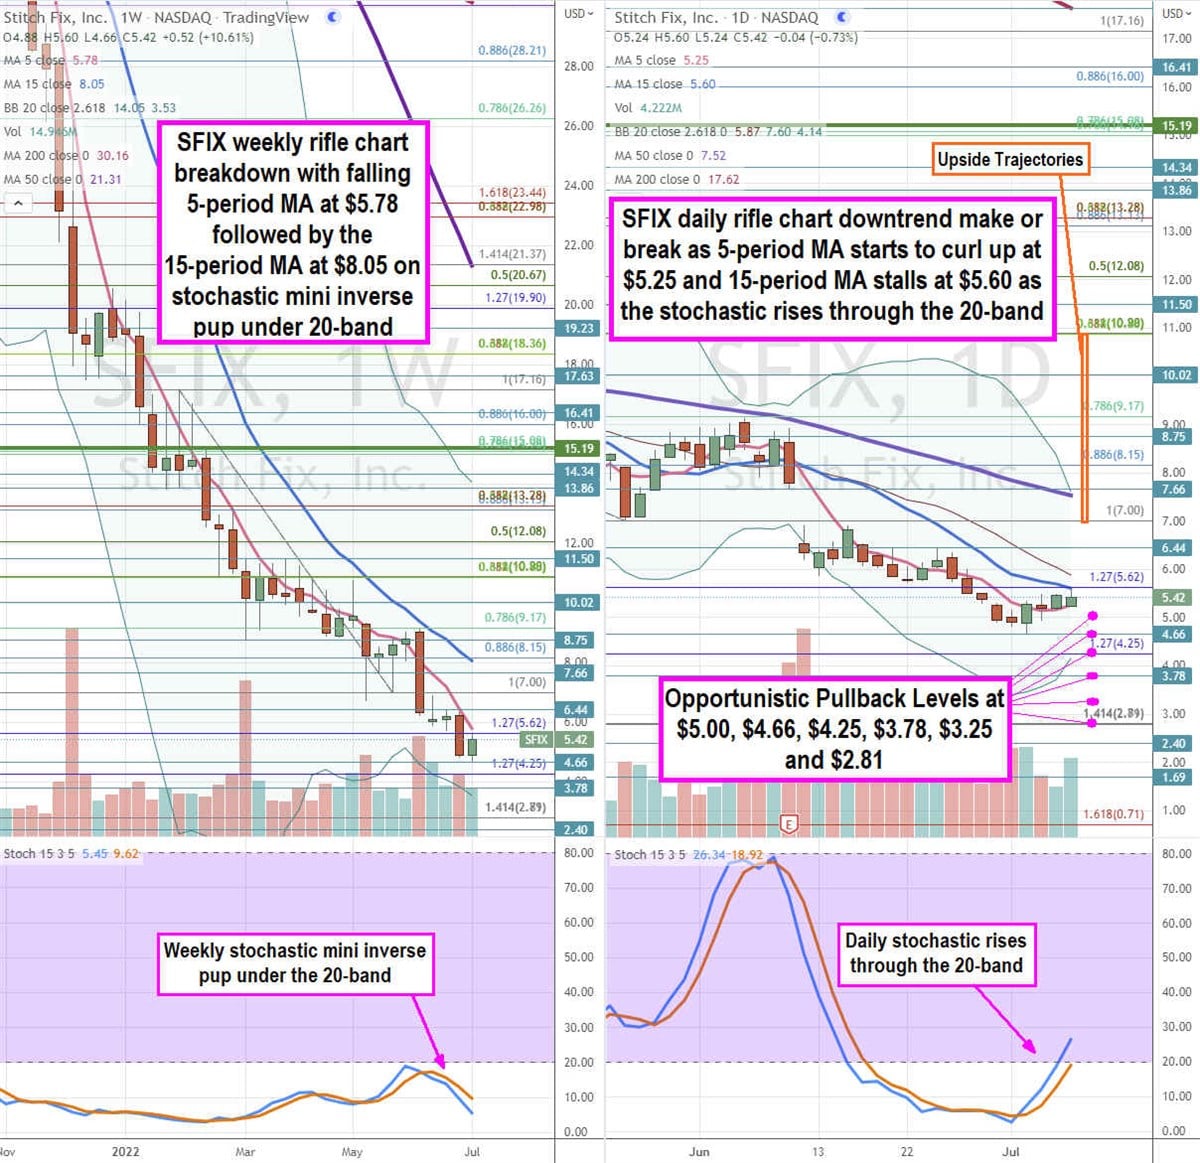
Using the rifle charts on the weekly and daily time frames provides a precision view of the landscape for SFIX stock. The weekly rifle chart formed an inverse pup breakdown on the rejection off the $9.17 Fibonacci (fib) level. The weekly downtrend has a falling 5-period moving average (MA) at $5.78 followed by the 15-period MA at $8.05. The weekly lower Bollinger Bands (BBs) sit at $3.53. The weekly stochastic formed a mini inverse pup on the rejection off the 20-band. The weekly market structure low (MSL) buy triggers above $15.19. The daily rifle chart is in a make or break as the downtrend stalls with a flat 5-period MA at $5.25 followed by the 15-period MA at $5.60. The daily stochastic crossed up through the 20-band. The daily upper BBs nearly overlap with the daily 50-period MA at $7.52. The daily lower BBs sit at $4.14. Opportunistic pullback levels sit at the $5.00, $4.66, $4.25 fib, $3.78, $3.25, and the $2.81 fib level. Upside trajectories range from the $7.00 fib up towards the $10.88 fib level. Investors can also look for value in competitors like The Gap (NYSE: GPS) and Farfetch (NASDAQ: FTCH).


